 The Organization of Behavior Over Time:
Insights from Mid-Session Reversal
Rebecca M. Rayburn-Reeves and Robert G. Cook
Tufts University
Reading Options:
Continue reading below, or:
Read/Download PDF | Add to Endnote
Abstract
What are the mechanisms by which behavior is organized sequentially over time? The recently developed mid-session reversal (MSR) task offers new insights into this fundamental question. The typical MSR task is arranged to have a single reversed discrimination occurring in a consistent location within each session and across sessions. In this task, we examine the relevance of time, reinforcement, and other factors as the switching cue in the sequential modulation of control in MSR. New analyses also highlight some of the potential mechanisms underlying this serially organized behavior. MSR provides new evidence about how cues interact to compete for the control of behavior within and across sessions. We suggest that MSR is an excellent preparation for studying the competition among psychological states and their resolution toward action.
Keywords: mid-session reversal, behavioral organization, timing, anticipation, switching cue, discriminative cue
Author Note: Dr. Rebecca M. Rayburn-Reeves, Department of Psychology, Tufts University, 490 Boston Ave., Medford, MA 02155.
Correspondence concerning this article should be addressed Dr. Rayburn-Reeves at beckyreeves02@gmail.com.
Acknowledgments: This research and its preparation were supported by a grant from the National Eye Institute (#RO1EY022655) to RGC. We thank the members of the Cook lab (Ali Qadri, Dan Brooks, Ashlynn Keller, and Suzanne Gray) for the many stimulating conversations about MSR and its possible mechanisms during the preparation of this paper. We would also like to extend an additional thanks to Ali and Ashlynn for their assistance with the manuscript and citations. E-mail: Robert.Cook@tufts.edu. Home page: www.pigeon.psy.tufts.edu.
The Sequential and Temporal Organization of Behavior
How do different behaviors come to be organized or sequenced as observed in the natural world? What processes ultimately determine which specific behaviors are exhibited in any next moment? How is behavior organized such that all of its global and local components unfold in the right order and at the right time to optimize an adaptive response? Understanding the answers to such questions is as salient today as when Lashley wrote his seminal paper on these general issues (Lashley, 1951). He suggested that the temporal integration of behavioral sequences was “. . . both the most important and also the most neglected problem of cerebral physiology” (p. 112). More than 60 years later, we have made progress in our understanding of the correlates and mechanisms of specific behaviors, but find ourselves still asking the same general questions about how complex behavioral sequences are learned and organized.
The psychological and neural processes that govern the order and timing of complex behavior, be it making coffee or engaging in a conversation or attracting a mate, remain poorly understood. While there has been a historical focus on humans, especially in regard to the complexities of learning and processing language and its syntax, animals face the same problems of selecting and organizing their behavior with respect to time and order. Performing a mating ritual in the wrong order or at the wrong time, for example, is maladaptive, even if all of the behavioral elements are present. Such information is also critical to understanding and treating humans exhibiting disorganized or maladaptive behavioral patterns (e.g., addiction, OCD, ADHD, schizophrenia, depression). As an example, research has shown that patients with schizophrenia exhibit losses in temporal continuity, where the subjective experience of events in time becomes fragmented or disordered (Andreasen, Paradiso, & O’Leary, 1998; Martin, Giersch, Huron, & van Wassenhove, 2013). In a similar vein, impairments in time perception based on interactions with working memory and inhibitory processes have been documented in patients with ADHD (Barkley, 1997). Therefore, understanding the mechanisms by which evolutionarily adaptive behaviors are selected and governed by temporal and sequential regularities is critical to a complete theory of psychology.
In any complex environment there are often multiple cues that could be used to select among competing behaviors at any given moment. Adaptive behavior relies on the ability of animals to attend to the most appropriate cue or cues in any context and to flexibly switch to new or changing cues depending on their relative utility across time. The additional ability to temporally anticipate which cues and behaviors will lead to profitable outcomes would be especially valuable in a world where temporal regularities exist. Antle and Silver (2009) argue that anticipation in both cognitive and noncognitive systems is critical to successfully navigating dynamic and complex environments. Because many environmental events have temporal periodicities occurring on different time scales (e.g., daily, annual, lunar), it is perhaps not surprising then that many animals have evolved specialized physiological and cognitive mechanisms that seem to take advantage of these temporal regularities. The highly visible seasonal migrations of many species, as well as the strongly organized circadian behavior by virtually all species, are well-known examples of this type of temporal organization. In both of these domains, a combination of endogenous (e.g., hormone levels, circadian clocks, etc.) and exogenous (e.g., day length, temperature, etc.) factors within these larger temporal structures have been identified to support the organization and sequencing of such behaviors (Buhusi & Meck, 2005).
Aside from the systems that have evolved to regulate behavior at these larger time scales, processing the passage of time itself would be a highly valuable and informative cue for predicting environmental changes that have regular and repetitive temporal properties. A timing system, whether consciously available to the organism or not, could provide information about when significant events will recur. Such temporal perception allows animals to anticipate and predict significant environmental changes and make appropriate responses at the right time. The study of associative learning can be characterized as observing what types of behaviors are exhibited in reaction to recent stimuli or environmental signals in the temporal stream (Miller & Barnet, 1993). Traditionally, time perception has most often been examined by assessing how well an animal can judge the passage of time, such as in time estimation tasks (Buhusi & Meck, 2005; Roberts, 1981) or discriminate between two different temporal durations, such as in time discrimination tasks (Meck & Church, 1983). Thus, time perception research of this type examines how specific behaviors are mapped onto specific time durations (e.g., pecking a red key after 4 s and a blue key after 8 s) as tested on individual trials. Such studies have provided a wealth of knowledge about how human and nonhuman animals perceive the passage of time within a range of seconds to minutes, a phenomenon known as interval timing (Buhusi & Meck, 2005; Cheng & Roberts, 1989, 1991; Matell & Meck, 2000; McMillan & Roberts, 2013; Meck & Church, 1983; Staddon & Higa, 1999).
While we have made considerable progress at understanding the perception of time on macro-level (e.g., daily, annual) and micro-level (e.g., milliseconds to minutes) time scales, the organization of behavior across a series of events that occur over more intermediate time scales (many minutes to hours) has received far less attention (Buhusi & Meck, 2005). One reason for this lacuna has been a lack of experimental procedures that permit looking at this level of behavioral organization. In humans, it is often presumed that this type of behavioral organization requires integrating a number of discrete events across time (Lewis & Miall, 2006; Vicario, 2013). How nonhuman animals utilize, or are influenced by, the passage of time in the regulation of their behavior over a long series of events is still unclear. Recently, a new procedure has been developed that offers insights into how such extended behavioral patterns are learned and regulated within the course of a session.
This review paper summarizes and examines recent empirical research on the mid-session reversal (MSR) task (Cook & Rosen, 2010; Rayburn-Reeves, Molet, & Zentall, 2011). We believe it offers new theoretical insights into how animals organize their behavior at such intermediate time scales (i.e., over a session). We further suggest that MSR is an excellent preparation for studying the competition among various psychological states and the mechanisms of their resolution that eventually leads to a specific action or series of actions. We begin by introducing this type of reversal task and presenting data from different studies to illustrate the consistent organization of behavior that emerges in this task. We then discuss the various types of cues available to inform behavioral choice within a session and how they modulate the behavioral patterns observed. We end by considering several new analyses that reveal more about the possible mechanisms for how competing task choices are selected and organized within individual sessions. We believe this research approach provides a new window into how animals learn, maintain, and organize the serial nature of their complex behaviors.
The Mid-Session Reversal Task
Discrimination reversal learning has a long history as a means for studying cognition in nonhuman and human animals (Bitterman, 1965, 1975; Mackintosh, 1974; Tinklepaugh, 1928). Reversal training consists of successfully teaching an animal to discriminate between a set of stimuli and then reversing the reward values of the alternatives and observing the subsequent learning of the new contingencies. In serial reversal learning, each time the new discrimination is learned to some performance criterion, the contingencies are reversed (Bitterman, 1975). Basing the reversal on the animal’s performance makes the time to any subsequent reversal unpredictable, making the changed reinforcement contingencies from recent trials the most reliable cue an animal can use to shift its discriminative behavior.
Mid-session reversal is different from serial reversal learning tasks in that each session contains a discrimination reversal that occurs at a consistent point in the session, most typically after a fixed number of trials. As a result, it offers a new way to assess how animals come to manage the transition between the two task contingencies. In an MSR discrimination task each session starts with one task contingency, and then halfway through the session the contingency is reversed. For instance, an animal could be tested with a simultaneous visual discrimination in which choice responses to a red stimulus are rewarded for the first half of the session (red+/green–), and then choice responses to a green stimulus would be rewarded for the second half of the session (red–/green+). Responses to incorrect stimuli typically result in a short time-out. The reversal’s regular occurrence after a specific time or trial and the resulting predictability introduces a number of cues in MSR tasks that could be used to reliably predict the reversal. Besides counting the number of trials until the reversal, for example, animals could keep track of elapsed time, since the timing of events constituting each trial is also quite regular. The specifics of this important latter issue are considered more fully in the next section following a brief outline of the main features of MSR behavior.
Studies using the MSR procedure have revealed a highly consistent pattern of choice behavior across a session. Shown in Figure 1 are the post-acquisition results from three separate investigations examining dissimilar types of visual discriminations with pigeons using an MSR procedure (Cook & Rosen, 2010; McMillan, Sturdy, & Spetch, 2015; Rayburn-Reeves et al., 2011). Within each investigation, the same stimuli were consistently ordered with respect to time across trials within each session. The only thing that changed was the identity of the correct stimulus. This was always reversed, or switched, midway through a session. Identical to the way psychophysical functions are shown, each curve depicts the proportion of the birds’ responses to one stimulus choice relative to the alternate stimulus choices. Thus, choice behavior is plotted as the percentage choice of the correct stimulus of the first task as a function of trial number across a session. As a result, successful choice behavior for both tasks is reflected by high values at the beginning (performing Task 1) and low values at the end (performing Task 2) of each session, respectively.
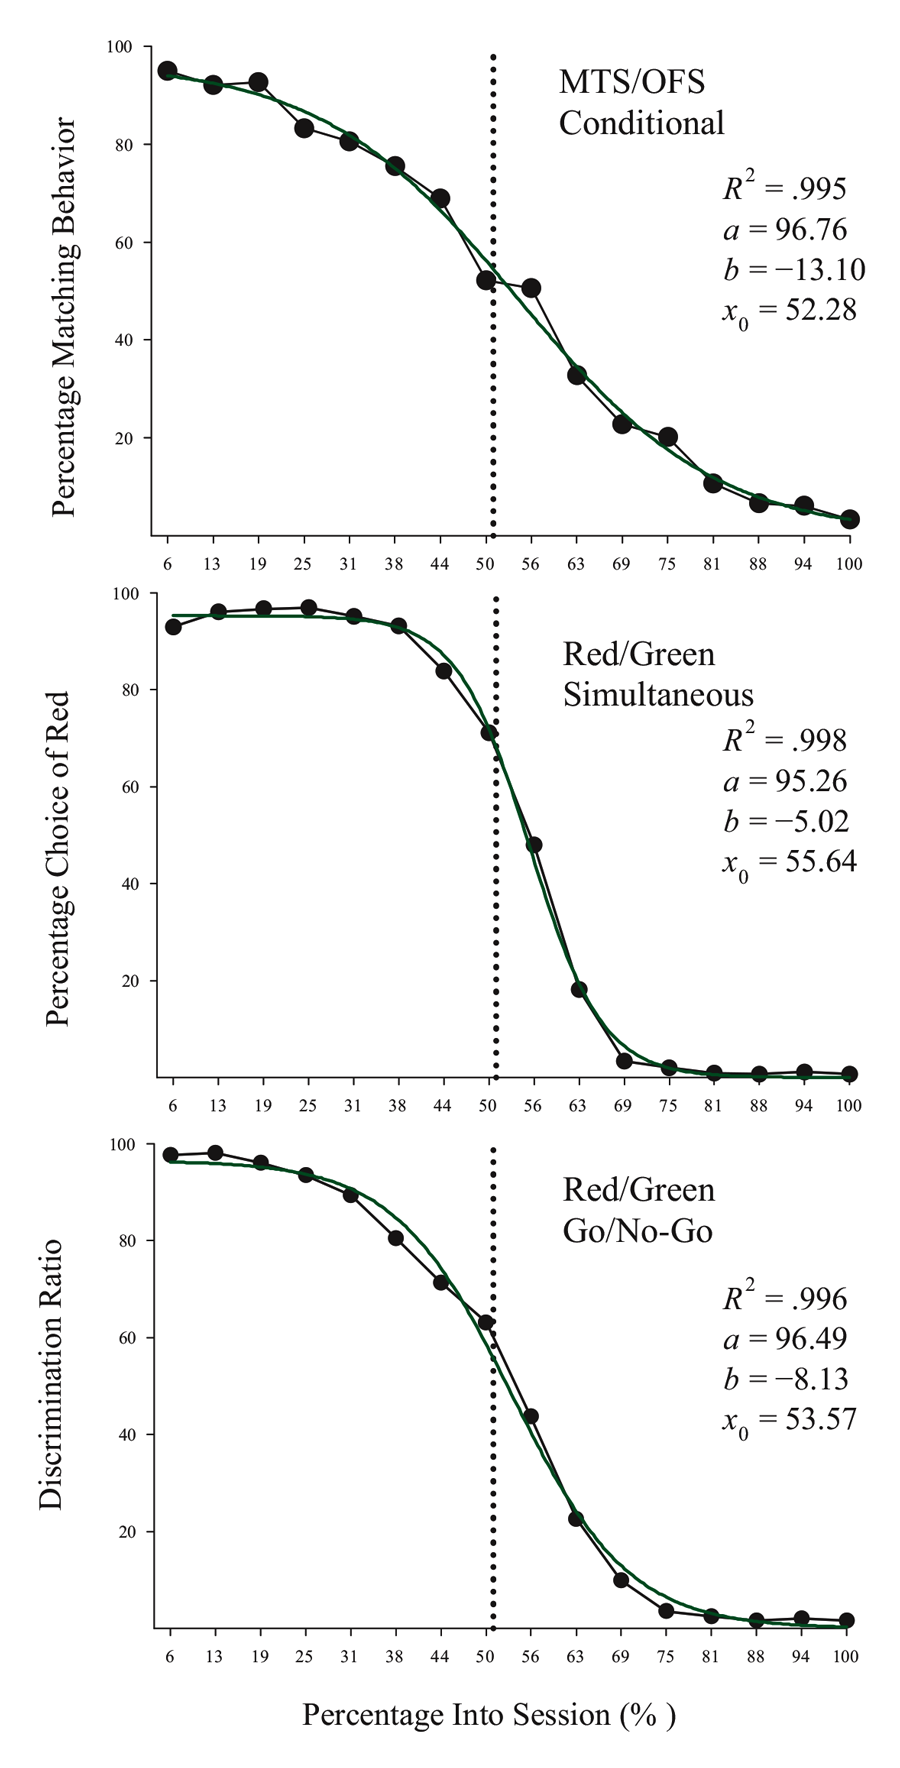
Figure 1. Percentage choice of the first correct stimulus as a function of trial number averaged across pigeons. The top panel is data taken from Cook & Rosen (2010) for four pigeons on a conditional MTS/OFS discrimination. The middle panel is data taken from Rayburn-Reeves, Molet, and Zentall (2011) for 10 pigeons on a simultaneous discrimination. The bottom panel is data taken from McMillan, Sturdy, & Spetch (2015) as a discrimination ratio (Task 1 / (Task 1 + Task 2) for a Go/No-Go procedure. The 3-parameter logistic function (dark green lines) for the fitted data is: f = a ∙ (1 + exp(–(x – x0) ∙ b)).
The top panel shows the average results from pigeons performing related conditional discriminations across the two segments within each session (Cook & Rosen, 2010). In the first half of each session, pigeons were rewarded for performing matching-to-sample responses (e.g., if red, choose red; if cyan, choose cyan) and in the second half they were rewarded for oddity-from-sample responses (e.g., if red, choose cyan; if cyan, choose red). The middle panel shows the results of pigeons performing a simultaneous, two-alternative simple choice discrimination using red and green stimuli (Rayburn-Reeves et al., 2011). Here in the first half of a session, choice responses to the red stimulus were rewarded, while in the second half, choice responses to the green stimulus were rewarded. The bottom panel shows the results of pigeons performing a successive go/no-go discrimination using red and green stimuli (McMillan et al., 2015). In this task, responses to the red stimulus were rewarded when presented in the first half of the session, while responses to the green stimulus were rewarded when presented in the second half. Despite the different task organizations of these discriminations, at asymptotic performance the pigeons exhibit highly similar behavioral characteristics over the course of a session, suggesting that the same mechanisms are likely regulating the observed behavioral pattern across these experiments.
The common result is that, regardless of the task, all pigeons learned to accurately discriminate and order each of the competing task contingencies (e.g., matching to oddity; red to green). This switching function reflects that the predictability of the reversal at the midpoint of a session, as well as the consistent ordering of reinforcement contingencies associated with the discriminative stimuli, allows the pigeons to learn and respond to the appropriate task during the correct portion of a session. Figure 1 also reveals that this highly organized and consistent reinforcement structure over training results in a similar pattern of choice behaviors across a session, regardless of the nature of the stimulus contingency (simple or conditional) or the type of discrimination (simultaneous or successive). In addition to the high accuracy at both terminal points of each session, there is a smooth, sigmoidal transition seen in all three panels. When averaged over sessions, it appears the pigeons gradually and probabilistically stop performing the first discrimination and start performing the second one. This gradual transition results in a function depicting a systematic reduction in choice accuracy based on proximity to the reversal. For each of the discriminations in Figure 1, a logistic function has been fitted to each result. Three parameters control the shape of the function. These parameters include the asymptote (a), inflection point (x0), and rate of change (b) of the curve. This function produces excellent fits (R2s > 99%) to all three discriminations. The excellent baseline performance for each of the tasks in the experiments is reflected in the high asymptote parameter value confirmed for each fit (as > 95%). The second parameter of this fit captures the inflection or “indifference” point at which the pigeons respond equally to both Task 1 and 2. The fitted inflection points are near and slightly after the reversal midpoint of each session (expressed as a percentage of the session—top panel: 52.3%, middle: 55.6%, and bottom: 53.6%). The third parameter captures the rate of change in task responding across the function. Here the three experiments appear to differ. The conditional discrimination is more difficult for the birds to reverse than either of the two simple discriminations. It has a shallower slope reflected in a slower rate parameter (b = −13.10) than the other two discriminations (middle b = −5.02 & bottom b = −8.13), which show sharper transitions between the two halves of the session. Nonetheless, all three experiments reveal the same basic changes in accuracy and gradual transition from Task 1 to Task 2 across the session. This transition results in two distinct types of errors made by the pigeons within and across sessions.
The first type of error is that of anticipation. This is where responses appropriate to the second task occur before the reversal. These errors are interesting as their orderly nature and increasingly greater occurrence near the reversal reveals them to be task-related mistakes. Thus, there is some degree of competition or loss of stimulus control between the two tasks near the reversal. Revealingly, these anticipatory errors persist and reoccur, despite the fact that there is never a reward for switching to the second task early. In fact, as the reversal point approaches, the frequency of anticipatory errors increases. This reversal-related increase suggests that these errors are internally generated intrusions of the second task into performance of the first one.
The second type of error is making perseverative choices. These are errors where choice responses from the first task continue on after the reversal. These errors also persist despite the consistent feedback after the reversal that responses appropriate to the first task have not, and therefore likely will not, result in further reinforcement in that session. The information provided by these two types of errors is not equivalent. When errors are made in anticipation to the second task, the animal is informed that its choices on the current trial were incorrect, but it does not guarantee that the next Task 1 response will not be rewarded. When a perseverative error occurs, however, it should provide unambiguous information to the animal that Task 1 responses will no longer be reinforced in that session and, therefore, the remaining responses should only be to Task 2. The persistence of these perseverative errors throughout training, however, suggests that this latter type of feedback does not easily result in rapid switching to Task 2 in pigeons (see section below on control of switching behavior by reinforcement cues).
Despite the potential difference in feedback provided by these two errors, they seem to occur symmetrically around the reversal. This generalized pattern among the competing tasks and choices indicates that the behavior of the pigeon is strongly organized by some mechanism that is not solely based on reinforcement feedback across the course of a session. The next key question thus becomes what cue or cues modulate the changing choice behavior as the pigeons sequentially move from performing one action to a competing action across a session.
Control of Switching Behavior in Mid-Session Reversal
An MSR task can be considered to have two distinct types of cues. The first type is consistent with the traditional discriminative cues that directly receive choice behaviors and lead to rewarded outcomes as required by simple or conditional discriminations. These are the stimuli available to the animal during a trial to which it can respond (e.g., red and green key lights). The second type of cue can be thought of as the switching cue. The switching cue is a conditional, context-like cue that controls or sets the occasion for which discriminative cue the pigeon should select during each part of a session. Because the reversal most typically occurs at the midpoint of each session in MSR tasks, this predictability introduces multiple potential sources of switching cues that could be used to predict the reversal. Among the internal or endogenous switching cues potentially available are time elapsed within the session, counts of the number of trials that have occurred, or relative satiety. Among the external or exogenous cues would be the reinforcement outcomes from recent responses or other additional external cues that could identify each portion of a session (Rayburn-Reeves, Qadri, Brooks, Keller, & Cook, under review). Isolating the source of the switching cue controlling the sequential performance of the two discriminations has been a top priority in the initial analyses of MSR.
Endogenous sources of switching control were among the first type of cue to be examined. For instance, the degree of relative satiety was ruled out early on as a switching cue (Cook & Rosen, 2010). Using a pre-feeding manipulation prior to a session, no evidence was observed that the pigeons were using their degree of hunger as the basis for changing their choice behavior across a session. Instead the experimental evidence has consistently indicated that the pigeons are using elapsed time within a session as the primary means for resolving the competing choice behaviors of each task. This is important to establish because the vast majority of MSR research has typically used a simple count of the number of trials to easily program the computer to reverse the tasks within a session. This creates the possibility that pigeons could have used counts or estimations of the number of trials, or perceived amount of behavioral experience, from the start of a session to guide their transition in choice behavior. These do not appear to be the case. Time seems to be the essential switching cue.
Compelling evidence for use of elapsed time as the switching cue has come from direct manipulations of time within and across sessions. Cook and Rosen (2010) found that inserting an empty temporal gap of different durations into the middle of the first half of a session resulted in systematic shifts in the onset of subsequent oddity-based behaviors. This suggests that pigeons were timing through the gap and prematurely switching based on the total elapsed time since the session start, regardless of their experience. They also trained pigeons on 20, 40, and 80 min sessions where the switch occurred at the temporal midpoint of the session (i.e., 10, 20, or 40 min., respectively). Therefore, regardless of the number of trials initiated by the pigeons during these time periods, the reversal occurred on an exclusively time-based schedule. Non-differentially reinforced probe sessions after this training confirmed that the same highly regulated switching behavior occurred near the temporal midpoint of the sessions. As the internal perception of the passage of time was the only reliable source of information in these procedures (i.e., nothing externally physical is changing from trial to trial), the resulting switch from matching to oddity behavior would have had to be controlled by mechanisms related to this temporal cue.
Further support for the use of a timing cue in MSR was also provided by McMillan and Roberts (2012). They trained pigeons on a simple discrimination using red and green stimuli with a 6 s inter-trial interval (ITI) between each trial. Probe sessions were then conducted in which this ITI duration was either doubled to 12 s or halved to 3 s. With the longer ITIs the pigeons made significantly more anticipatory errors as the birds prematurely switched to the second behavior earlier than when the ITI was 6 s or 3.0 s. Correspondingly, they made significantly more perseverative errors with the 3 s ITI duration, by switching to the second behavior later than during sessions with 6 s or 12 s ITI lengths. Both of these systematic changes in errors as a function of ITI indicate the pigeons were using the elapsed time, as opposed to counting trials, to predict the location of the discrimination reversal. Given such findings, the observation of any anticipation errors prior to the reversal is likely a good indirect marker that some form of elapsed time is the switching cue controlling an animal’s choice behavior in MSR.
A recent study by McMillan et al. (2015) has added further insights into this general issue. They tested a go/no-go successive discrimination version of an MSR task (see bottom panel of Figure 1). While the summary results with this task look similar to the other discriminations in Figure 1, the cues controlling the switching behavior of the pigeons were further illuminated by the authors examining pecking behavior separately for the different reinforced go and non-reinforced no-go trials on each side of the reversal (see Figure 1a from McMillan et al., 2015). This breakdown revealed that the pigeons rarely failed to peck the correct stimulus of each task on either side of the reversal. This approach ensured maximizing reward on all reinforced go trials. It was only on the no-go stimulus of each task that birds made errors. The pattern of these errors suggests that the behavior with the two tasks was likely controlled by different mechanisms. As a session progressed, the pigeons increasingly failed to inhibit pecking to the first task’s no-go stimulus as the trials approached the reversal. These anticipation errors prior to the reversal were likely mediated by some criterion-based timing cue generated from between-session averaging of the time to the reversal. This ensured maximizing reinforcement because the pigeons were pecking the upcoming correct Task 2 stimulus on every presentation just prior to the reversal, as well as pecking the correct Task 1 stimulus at this point. After the reversal, preservative errors to the formerly correct Task 1 stimulus also persisted and required a number of non-reinforced responses to extinguish. These persistent errors after the reversal are, in contrast to timing, likely mediated by within-session excitation related to the pigeons’ recent experience with the first task (i.e., repeated reinforcement for Task 1 responses up to the reversal). Overall, this two-part approach by the pigeons ensured that all rewards were collected on both types of go trials with only one of the two discriminative stimuli (the correct stimulus of Task 2) being timed, and the other (the correct stimulus of Task 1) being controlled by within-session excitation. This single-stimulus timing account is likely a product of the successive nature of the go/no-go procedure where separate presentations of a single stimulus occur on each trial. It is hard to imagine how such a single-stimulus timing mechanism could account for MSR reversal behavior involving more complex stimulus arrangements where more rules and stimulus combinations are involved, such as in a matching-to-sample procedure.
Daniel, Cook, and Katz (2015), for instance, recently conducted an MSR experiment to examine whether pigeons could learn to conditionally switch behavior between two abstract concepts over a session. Pigeons were trained to switch from a matching-to-sample (MTS) to an oddity-from-sample (OFS) task within a session, similar to the procedure used by Cook and Rosen (2010). Of more importance, however, was the use of much larger stimulus sets to train each concept. This was done because large stimulus sets are known to promote concept learning in pigeons (Bodily, Katz, & Wright, 2008; Cook & Wasserman, 2006; Katz & Wright, 2006; Wasserman, Kiedinger, & Bhatt, 1988; Wright, Cook, Rivera, Sands, & Delius, 1988). Over a series of extensive training sessions and stages, the set size of the number of randomly combined stimuli involved in each of those two tasks was increased from three to six to 12 items. Most critically to the question of timing is that all birds showed highly similar, almost linear, switching functions that exhibited large degrees of anticipatory and perseverative behavior. This was true regardless of the number of stimuli involved within each part of the session. Because of the very large and changing number of stimulus pairs involved, it is hard to see how asymmetrical timing of a single stimulus could be involved. This is perhaps because every stimulus is simultaneously a correct and incorrect stimulus intermixed within each part of a session. The switching function indicates that a timing mechanism based on collective groups of matching and oddity relations seem to be involved. Interestingly, no evidence was found in transfer testing that the pigeons had learned to time the twin general concepts of matching or oddity as the means to switch behaviors on the MSR task. Instead the pigeons seemed to learn each portion of the MSR task by learning to time the different sample-specific arrangements. This need to memorize and track many arrangements simultaneously may be one reason why strongly linear switching functions were observed in that experiment in comparison to the typically sigmoidal function seen with simpler discriminations (see Figure 1).
A possibly related result can be seen in unpublished results of an MSR experiment done subsequently with the same birds as tested in Cook and Rosen (2010). In this case, each bird learned in succession a series of MSR discriminations involving MTS and OFS conditional discriminations with three different groupings of sample stimuli (first set: red & cyan; second set: yellow & violet; third set: blue & green). After training each of these stimulus groupings separately in succession, pigeons were given sessions where all three groupings of sample stimuli were randomly intermixed across trials, with the reversal from MTS to OFS remaining at the midpoint of each session. Figure 2 shows the averaged switching functions from the last 10 sessions where the three sample groups were randomly intermixed within each portion of the same session. Each stimulus group exhibits similar overlapping functions with comparable degrees of anticipatory and perseverative errors. These overlapping functions occurred despite the fact that the testing order of the specific samples was completely randomized within each session. These results rule out the possibility that the amount of experience or timing of specific stimuli were critically involved in mediating switching in this conditional discrimination MSR task. It instead suggests that the switching function is the result of increasing internal competition between the representations of Task 1 and Task 2 as a function of reversal proximity.
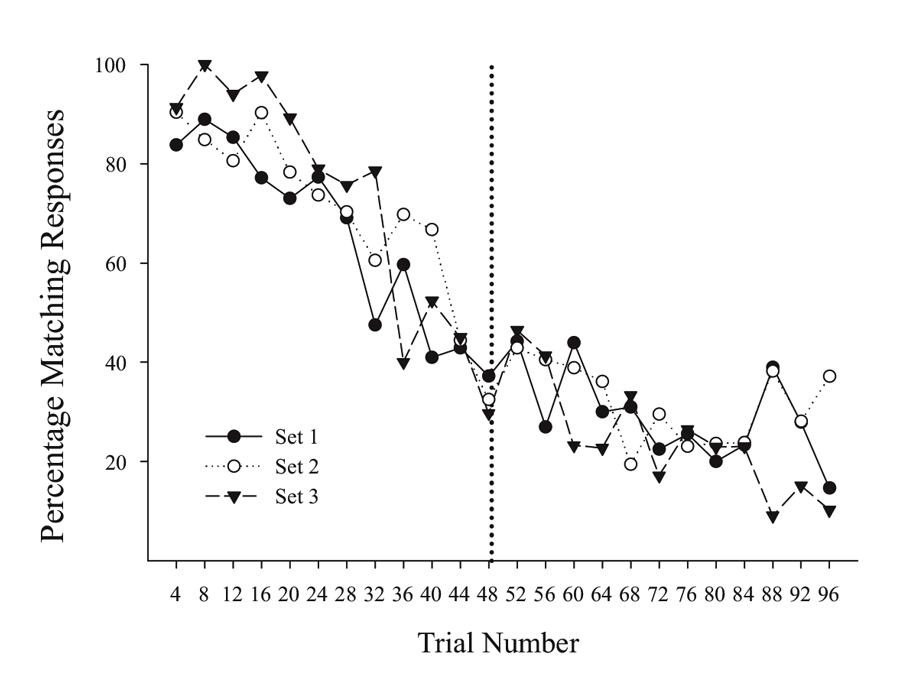
Figure 2. Percentage choice of matching responses for the three sets of stimulus pairs across trials within a session. Figure taken from unpublished data associated with Cook and Rosen’s (2010) subsequent experiments.
The general preference for using a time-based cue in the MSR paradigm parallels similar research on time-place learning (TPL) experiments with animals. Time-place learning experiments require the animal to shift to different spatial locations based specifically on an elapsed time during which reinforcement is available in each location (Wilkie, 1995). Thus, TPL tasks directly test the ability of animals to utilize time as a predictive cue for which location is currently providing reinforcement. For example, Wilkie and Willson (1992) trained two pigeons in an operant task using 90-s trials in which intermittent reinforcement was available for 30 s at each of three key locations across a trial. They found that the pigeons allocated the majority of their responses to the correct key during the time in which it provided reinforcement. They also found that the pigeons sometimes began responding on the to-be reinforced response key before that key provided food. They suggested this behavior was evidence that pigeons were anticipating the change in reinforcement across keys as a function of an interval timing cue. One major difference between TPL and MSR tasks, however, is that in the former, the passage of time is the best cue for where reinforcement will be located. This is because reinforcement occurs probabilistically due to the use of an intermittent interval schedule of reinforcement. This creates ambiguity as to when a particular key will stop providing reward. If the schedule of reinforcement was not probabilistic, it might be assumed that animals would use the reinforcement outcome as the primary feedback cue to switch key responses. The MSR task illuminates the fact that even providing unambiguous outcome information does not result in primary use of the reinforcement cue. Rather, both TPL and MSR tasks reveal that pigeons regularly rely on the passage of time as a cue for organizing sequences of behavior over a repeated series of events.
Control of Switching Behavior by Reinforcement Cues
The above results indicate that switching behavior in pigeons in an MSR task is predominantly controlled by time, at least when using visual stimuli as the relevant dimension for the discrimination. This reliance on time as the switching cue, however, is not the optimal solution. Short of counting each trial, one of the best cues would be to attend to the consequences of recent choices. For example, humans are excellent at MSR tasks (Cook & Rosen, 2010; Rayburn-Reeves et al., 2011). The reason for this is because humans learn to stay with the correct choice associated with the first task until an error occurs. At this point, humans immediately switch their choice behavior to the second task. This behavior is indicative of a win-stay/lose-shift strategy (Levine, 1975; Restle, 1962), where responses to one alternative persist until the first non-reinforced trial, where responses then shift to the other alternative. It is thought to be the optimal strategy in reversal tasks because it minimizes errors and results in rapid, flexible shifts in behavioral responses between the two tasks. Pigeons appear not to greatly attend to this valuable and highly useful exogenous cue in MSR tasks. This is a bit of mystery and has received considerable experimental attention. The next section reviews this material.
Variable Reversal Locations
To examine the relative contribution of reinforcement cues, much of this MSR research has focused on reducing the relevancy of time and increasing the saliency of reinforcement as the switching cue. Many studies have attempted to reduce the relevancy and predictability of the timing cue by randomly varying across sessions the trial at which the discrimination reversal occurs (McMillan, Kirk, & Roberts, 2014; Rayburn-Reeves, Laude, & Zentall, 2013; Rayburn-Reeves et al., 2011; Rayburn-Reeves & Zentall, 2013; A. P. Smith, Pattison, & Zentall, 2016).
In an initial study, Rayburn-Reeves et al. (2011) found that this variable reversal manipulation did increase the contribution of reinforcement cues to the control of pigeons’ switching behavior. They showed that when reversals occurred early in the session, pigeons produced more perseverative than anticipatory errors, but clearly responded to the reinforcement shift by switching to the second task earlier than when the reversal was presented later in a session. During sessions when the reversal occurred at these later points within the session, perseverative errors decreased and anticipatory errors increased. Furthermore, the fewest combined errors of both types were found when the reversal occurred at the midpoint of the session. The latter result suggests the birds were likely using temporal information from across a number of sessions to compute an aggregate expectation of when Task 1 or 2 would be in effect. Similar molar aggregations from across sessions seem to have occurred in other studies using variable reversal locations as well (McMillan et al., 2014; Rayburn-Reeves, Laude, et al., 2013). In fact, any anticipation of a reversal within a session, variable or not, represents this type of molar aggregation operation from across prior sessions.
Nonetheless, because of the asymmetry in the rate and types of errors made across the different reversal locations, it appears the pigeons can be sensitive to the changing reinforcement contingencies, at least as experienced over a number of trials. If pigeons were solely using the time within the session as a cue based on an aggregate of previous sessions’ reversal locations, the actual location of the reversal event during the current session should not have made a difference. Taken together, these results suggest that when time-based cues are made less useful, control by recent outcomes increases in MSR. More important, it indicates that both external and internal cues can be used to guide behavioral choice in MSR, although their relative strength may vary depending on the circumstances. One interesting possibility is that reinforcement acts as a molecular or local cue, adjusting levels of excitation and inhibition across trials within sessions, whereas the timing cue is generated over a number of sessions, acting on a molar level in regulating responses across a single session. It seems to be the interplay between these two sources of information that combine to control the animals’ momentary course of action.
Role of Spatial Cues
Another factor that apparently produces greater attention to reinforcement as a switching cue involves using a spatial dimension as the critical discriminative stimulus for the first and second tasks. Across a number of experiments, pigeons have been tested with the two portions of the session involving a switch of reinforcing responses from one side key (e.g., left) to the other (e.g., right) at the midpoint of the session. From these experiments, the pigeons are clearly more sensitive to reinforcement outcome as a switching cue and appear less controlled by temporal cues than when tested on visual discriminations.
McMillan and Roberts (2012), for example, trained pigeons on an MSR task using a combination of relevant visual and spatial information. Across three phases, pigeons first experienced discriminations in which both spatial and visual cues were relevant (Phase 1), then only visual cues were relevant (Phase 2), and finally back to both cues being relevant (Phase 3). During Phases 2 and 3, probe sessions were intermixed in which the ITI length was either doubled (12 s) or halved (3 s). As described above, this allows assessment of the relevance of time as a switching cue. They found that accuracy around the reversal location was improved and sharpened when both dimensions were relevant in comparison to the visual-only phase. Further, probe sessions with the ITI manipulation resulted in large and expected temporal differences in the visual-only condition, consistent with pigeons’ use of elapsed time in a session as being the primary switching cue. In the combined visual-spatial task, however, these same ITI manipulations had little effect as the birds exhibited the same switching function in each ITI condition. This indicates that elapsed time was not the primary cue causing the switch from one response to the other. McMillan et al. (2014) and McMillan et al. (2015) found similar results indicating that the use of a spatial discrimination consistently sharpens switching accuracy in MSR tasks. This sharper discriminative transition at the reversal and pigeons’ general insensitivity to ITI manipulations when spatial information is directly relevant to the MSR each suggest that the pigeons were increasingly relying on local reinforcement contingencies to guide their switching behavior. These findings and those of Rayburn-Reeves et al. (2011) indicate that pigeons are sensitive to recent response-reinforcement feedback, especially when time is difficult to use and when space is the relevant discriminative dimension.
One possibility brought up by McMillan and Roberts (2012) was that spatial information provides a form of prospective cuing allowing the animal to appropriately orient toward the correct stimulus. Visual tasks do not afford that type of information, as the positions of the visual cues randomly change across trials. Having a spatial cue may increase accuracy by assisting the animals to bridge the gap between trials and making it easier for them to recognize changes in the reinforcement contingencies.
Memory and Reinforcement Cues
In an attempt to better clarify the role of the memory for prior trials versus sustained postural or location orientation during the discriminations, Rayburn-Reeves, Laude, et al. (2013) manipulated the time between trials to see whether shorter or longer ITI durations would produce more efficient use of the previous trials’ outcomes. One hypothesis based on a theory of memory decay is that if the animal is given too much time between trials it may not be able to remember its most recent experiences because of the decay in memory that occurs over time. Likewise, if given too little time, proactive interference between trials may become too great. In either case, too much or too little time between trials would make it difficult for pigeons to use their memories of prior choices and outcomes to guide behavior.
To examine this issue, Rayburn-Reeves, Laude, et al. (2013) trained three groups of pigeons on a spatial MSR discrimination task. Each group was given a different ITI duration (1.5 s, 5.0 s, or 10.0 s) during initial training. The hypothesis was that, if the memory for the previous trial weakened as a function of time, then the pigeons trained on the shorter ITI should perform better than the other two groups. Indeed, they found that pigeons trained on the 5.0 s and 10.0 s ITI lengths showed the typical anticipation errors around the reversal location, suggesting use of the time-based switching cue. In contrast, pigeons trained with the 1.5 s ITI length showed almost no anticipation, producing a strong stepwise function that suggested use of reinforcement cues. In a follow-up experiment, half of the pigeons from the longer ITI groups were transferred to the 1.5 s ITI task, while the remaining half continued with their previous ITI durations. Once transferred, the pigeons retrained on the 1.5 s ITI task also began showing near optimal performance, similar to the pigeons initially trained on the shortest duration. Finally, all groups were given training on the variable reversal task created by Rayburn-Reeves et al. (2011). Pigeons retained on the 5.0 s and 10.0 s ITI durations showed large numbers of anticipatory and perseverative errors as found in Rayburn-Reeves et al.’s (2011) study, whereas pigeons trained with 1.5 s ITI durations appeared to base responding almost entirely on the reinforcement cue, with few anticipatory and perseverative errors across reversal locations.
Laude, Stagner, Rayburn-Reeves, and Zentall (2014) further manipulated independently the ITI duration (1.5 and 5.0 s) and the relevant stimulus dimension (visual vs. spatial) by training four groups of pigeons on each combination of these two variables. These groups were chosen to parcel out whether the reduction in ITI length, the relevant stimulus dimension, or some combination of both was contributing to the differences seen in the previous research. If it was simply that ITI durations of longer than 1.5 s resulted in rapid declines in memory for the most recent trial, then the relevant stimulus dimension should not have mattered. Likewise, if the spatial as opposed to the visual discrimination affords greater use of reinforcement contingencies, then ITI should not matter. Laude et al. (2014) found that only the group trained with a combination of the spatial discrimination and a 1.5 s ITI length showed significant reductions in anticipation prior to the reversal as compared with the other three groups. These results strongly suggest that both the reduction in ITI length and the use of a spatial discrimination are necessary for optimizing performance by pigeons in MSR. Either element alone does not appear to be sufficient to produce a stepwise function indicative of a possible win-stay/lose-shift strategy. Taken together, these results suggest that when outcome information is recent enough in spatial discriminations, it seems as though pigeons can better utilize this type of information to refine and optimize their reversal behavior. Rayburn-Reeves, Laude, et al. (2013) point out that evidence for the use of reinforcement-based cues under short ITI durations needs to be assessed within the possibility that animals are using their postural orientation or physical location in the chamber as an important basis for choice.
An important observation about the pigeons’ ITI behaviors observed in the video records from their experiment sheds light on what might have been controlling performance across the session. During the long ITI durations, the pigeons regularly moved significantly more around the chamber than with the 1.5 s ITI. With less than two seconds between the hopper offset and the onset of the next trial, a pigeon only had enough time to raise its head and orient to the previously pecked location in space, resulting in it often standing and remaining on that side of the chamber and reaching toward the hopper with its head to eat. The authors suggested that one reason why the short ITI group performed so well was because they were able to develop a form of “procedural” memory based on a repetitive spatial peck-eat pattern. It was this pattern that could be easily disrupted by the absence of reinforcement on the reversal. This in turn caused them to move to the other side of the chamber on the following trials. Thus, positional orientation may be an important part of why spatial discriminations in general support much better use of reinforcement cues than visual discriminations in guiding switching behavior. By allowing the competing tasks (first left+, then right+) to be both more distinct and memorable, it may allow the animals a vehicle for reducing competition between discriminative choice behaviors near the session’s transition point.
Species Differences
As described, the majority of MSR research has been conducted using pigeons. One interesting comparative question is whether other animals would show similar MSR findings, such as the general preference for using temporal information over recent reinforcement information as the switching cue. Humans are clearly quite tuned to reinforcement outcomes. Their behavior is the gold standard for the exclusive use of the win-stay/lose-shift strategy, indicative of highly flexible behavioral patterns needed to optimize behavior in dynamic and complex environments. Does this extend to other mammals? To date, there have only been three studies examining MSR performance in rats, for instance. Additionally, in a concession to the rats’ poor visual acuity (Slotnick, 1984), all three involved spatial discriminations. Nonetheless, there is a history of processing differences in how rats and pigeons may attempt to solve different types of discrimination problems (Bitterman, 1965; Cheng & Roberts, 1989; Mackintosh, 1975; Mackintosh & Cauty, 1971). The same thing may possibly be true of MSR as rats seem to show a greater sensitivity to reinforcement outcomes as a switching cue than do pigeons.
Rayburn-Reeves, Stagner, Kirk, and Zentall (2013) trained rats on a spatial discrimination using standard operant levers. Under these conditions, rats learned the two competing tasks (left+ then right+) separated by 5.0 s ITIs to a high degree of accuracy, showing no anticipation prior to the reversal and little perseveration afterward. In a follow-up experiment, rats were then transferred to the variable reversal task and finally given training on multiple reversals within a single session. Throughout the training phases, rats continued to show behavior indicative of win-stay/lose-shift responding based on reinforcement outcomes. The majority of errors occurred only on the first reversal trial. In a similar study, A. P. Smith et al. (2016) trained two groups of rats on an MSR spatial task with 5 s ITI durations using either lever presses or nose-pokes as the two choice response manipulanda. Both groups showed similar acquisition rates to each other and very few errors around the reversal, suggesting that the nature of the response is not critical to the rats.
McMillan et al. (2014) attempted to better understand why rats might be so good at MSR and why they appeared to show increased sensitivity to trial outcomes. They reasoned that in spatial operant tasks, rats may be able to remain more stationary in comparison to pigeons during the intertrial intervals (see earlier discussion of postural and location orientation). If their spatial orientation between trials was helping to mediate choice behavior with the levers, then testing rats with a procedure in which this orientation could not be maintained might increase attention to timing cues. They tested rats in an open T-maze apparatus in which responses to the left and right arms were reinforced for the first and second halves of a 24-trial session. After each trial, the rats were restarted from the same central start box. This central start location essentially eliminated the ability of rats to spatially orient to the correct response location between trials, which is more akin to procedures typically using a central warning signal to start visual discriminations for pigeons in operant tasks.
In contrast to the excellent performance by rats in an operant setting, McMillan et al. (2014) found that the rats tested in a T-maze showed large numbers of anticipatory and perseverative errors around the reversal. This suggests that time may have been the more important switching cue in the T-maze setting. Even when the point of reversal was varied across sessions in a follow-up experiment, T-maze switching behavior did not markedly improve. The results from McMillan et al. (2014) suggest that prior differences between rats and pigeons in MSR may not reflect qualitative differences across these two species; rather, they may be due to the ability of the animal to spatially orient to the previously correct alternative during the delay between trials. It is possible that pigeons are simply more active during ITIs than rats in general, thus requiring reduced ITI length to mitigate the pigeons’ tendency to move around between trials.
Together such results suggest that the benefits of testing most spatial discriminations may stem from allowing animals to use and maintain postural or location orientation cues during the ITI. This allows them to be more sensitive to reinforcement cues and reduce their reliance on using time as the main switching cue in MSR. That said, a reliable finding with T-maze procedures in rats is that of spontaneous alternation (Brushfield, Luu, Callahan, & Gilbert, 2008; Dudchenko, 2004). Rats tend not to repeat a previous response in spatially constructed apparatuses, such as the T-maze, Y-maze, and radial arm maze, even with lengthy delays between trials (Dudchenko, 2004; Evenden & Robbins, 1984). Being such a robust finding in rats, this spontaneous alternation, or tendency not to revisit recent locations, might be indicative of a predisposition for exploratory behavior that is likely advantageous in the rat’s natural environment. Therefore, it may be that a task that requires repeated visits to a single location competes with a natural tendency not to repeat behavior in this manner, thereby creating competition between tendencies to alternate and perseverate. Thus, the use of previous reinforcement as a cue in spatial apparatus may produce competing sources of information (repeat vs. don’t repeat) for subsequent behavior in MSR tasks, which might be enough to shift attention to the time-based cue to mediate behavior. Such differences in procedures between the operant chamber and T-maze complicate the interpretation of MSR in rats with reference to their use of memory for the previous response-reinforcement association.
At the moment, it is unclear whether there exists a qualitative comparative difference between how rats and pigeons solve MSR. While rats, like humans, seem to attend more to reinforcement outcomes than pigeons, it remains to be clarified if this has a methodological source or not. Future research will need to parcel out better whether rats, as well as other types of species, learn to mediate the transition between the two competing tasks in MSR in a way that is qualitatively different from pigeons. Regardless of the final resolution, appreciating how other animals solve MSR across different circumstances will contribute to our understanding of how animals solve such complex sequential discriminations.
Within-Session Modulation of Switching Cue Competition
In the MSR tasks considered thus far, the ability of animals to use switching cues, such as elapsed time or reinforcement, seems to depend partially on factors related to memory, session organization, physical orientation, and the relevant stimulus dimension. Presumably, the specific use of any particular cue depends on its relative utility in comparison to all the available cues within a session (e.g., Egger & Miller, 1962; Mackintosh, 1975; Rescorla & Wagner, 1972).
The usefulness of different environmental cues or physiological processes in the real world is often transitory, however. In complex environments where multiple sources of information can exist and serve to cue significant upcoming events, their relative usefulness may depend on each other or interact over time. As a result, it would be important for animals to be able to flexibly adjust to such changing circumstances across time depending on the relative utility of available cues signaling which actions will lead to the most positive outcomes.
Given these kinds of considerations, we have recently been investigating the relative contribution of simultaneously available switching cues to the control of MSR by pigeons (Rayburn-Reeves et al., under review). One means of doing so involved the addition of distinctive external visual cues during the ITI to assist in identifying each portion of a session. The idea behind the addition of these visual cues was to see whether they served to differentiate the two tasks within the session and reduce control by the timing cue during MSR.
In these experiments, pigeons were given training with alternating sessions where distinctive color cues during the ITI were either present or absent. Cue-absent sessions mirrored standard MSR tasks where no external visual cues were available to denote each portion of a session. During cue-present sessions, the front screen was briefly illuminated by a blue hue during the ITIs of the first half of each session and a yellow hue during the ITIs of the second half of each session. As would be expected, pigeons were much better at the task with the addition of these external switching cues, showing reductions in both anticipatory and perseverative errors as compared with the cue-absent MSR condition.
Next, we put the external visual and internal timing cues in conflict with one another to assess their relative strength within sessions. Using probe sessions with the cue-absent condition, we presented the second half yellow hues during selective trials in the first half of the session (otherwise blue-cued) and first half blue cues during trials in the second half of the session (otherwise yellow-cued). By varying where in the session these conflicting “miscues” appeared, we could assess their relative influence and contribution to performance across a session. We found that the impact of the conflicting external cue depended on the location within the session at which it was inserted. Figure 3 presents a subset of the miscuing data from Experiment 4 reported in Rayburn-Reeves et al. (under review). The figure illustrates the baseline performance of the cue-absent session type (gray triangles) as compared with the cue-absent miscue session type (black circles), in which 10 trials were assigned as miscue trials within this session type (indicated in green). As can be seen, when conflicting external cues from the second half were presented at the beginning of the session, pigeons based responding primarily on the time within the session. That is, they responded appropriately to Task 1 indicating their choice behavior was being strongly controlled by the temporal cue and was not being influenced by the conflicting cue that just appeared during the ITI. Likewise, conflict cues from the first half of the session presented at the end of the session also produced a similar and non-influential outcome. At this point, too, all of their choice behavior was appropriate to Task 2 even with the conflicting cue. As proximity to the reversal increased, however, the conflicting external cues increasingly impacted choice behavior. This can be seen in the middle of the figure by the increasing number of choice responses that were specific to the ITI color cue. Thus, in the middle of the session, the conflict cues had a much greater influence on choice behavior than when they occurred at the beginning or the end of the session. Finally, there appeared to be a greater influence of miscuing prior to the reversal as compared with after.
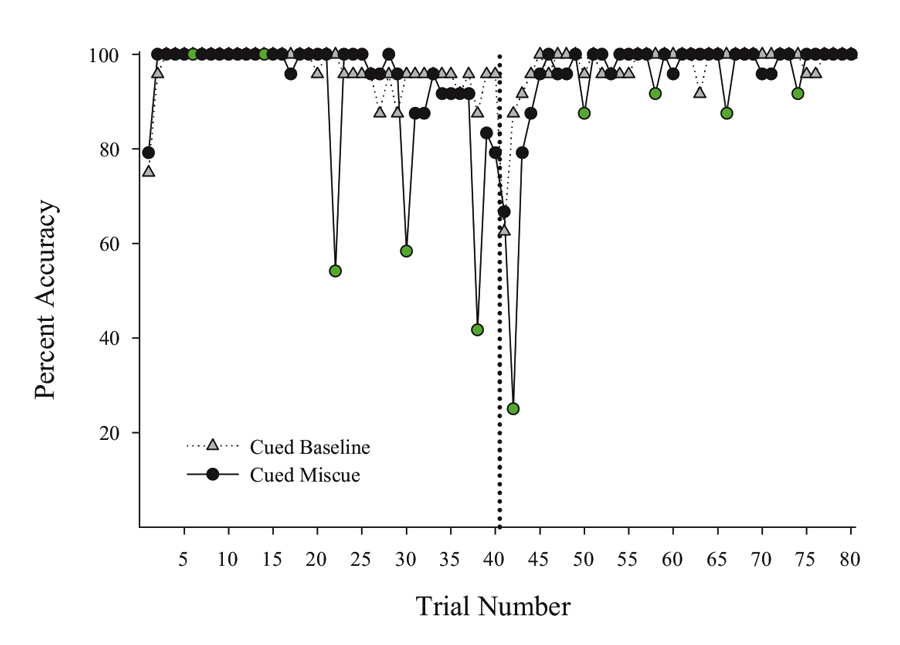
Figure 3. Percent accuracy for Cued Baseline (gray triangles) and Cued Miscue (black circles) session types based on trial number. Within Cued Miscue sessions, green circles indicate trials in which miscues were presented. The reversal is indicated by the dotted line. This data is taken from Experiment 4 of Rayburn-Reeves et al. (under review).
Such results indicate the pigeons were using both internal timing and external color cues to discriminate Task 1 from Task 2. More important, there was a trade-off between these cues’ influence depending on how close the pigeons were to the reversal. Thus, the relevance of particular switching cues appears to change over the course of a session. Pigeons appear to be dominated by the time at the session endpoints where time-based cues would be highly reliable. As the difficulty of using the timing switching cue increases near the temporally ambiguous reversal, the external ITI cues come to dominate as exhibited by their stronger influence on choice behavior. Thus, it appears pigeons are tracking multiple cues during the session and their attention to each of the cues changes depending on their relative utility. This is consistent with previous results where pigeons utilized the external cue provided by previous response-outcome associations to a greater degree when the timing cue was made less reliable (Rayburn-Reeves et al., 2011). That animals might be controlled by different cues depending on their utility is a well-established notion. The interesting and important new development from the above MSR experiments is that the influence of these different cues may change dynamically over the course of a session. Different cues may have various impacts at different times within a session. Dynamic cue use as a function of time is an interesting avenue of research that has received relatively little attention in the field of animal behavior and comparative cognition.
Analysis of the Switching Function in MSR
The published studies reviewed above identified key properties of MSR and advanced our understanding of the factors controlling behavioral change over a session. This section explores the possible theoretical underpinnings of these situations and their implications for the structure of animal discrimination learning and the organization of behavior. One good starting point is an important question centered on the sigmoidal behavioral pattern seen in these studies (see Figure 1). The exact contour of this function is modulated by several types of switching cues (i.e., time, external visual or spatial stimuli, and reinforcement) and these influence the function’s sharpness at the reversal. One essential question to address is the mechanism of control during the region of “poorer” accuracy covering the transition point between the two tasks. One distinct possibility is that the gradual transition between tasks at the reversal midpoint reflects the increased psychological competition and eventual resolution between the behaviors involved. If so, the MSR paradigm would be an ideal preparation for examining how such representational competition is involved in the sequential and temporal organization of behavior. Before accepting such an account, however, other possibilities need to be ruled out.
One alternative account of this gradual midsession transition considers the training history of the two competing tasks. The mixed nature of reinforcement at the temporally ambiguous midpoint may potentially result in increasingly less accurate choice behavior simply because the animals do not learn the tasks during this portion of a session. In this way, the transition through the 50% range, or inflection point (x0), would directly reflect an absence of knowledge based on a loss of stimulus control by the separate tasks. This confusion account appears to be unsupported. Evidence against this confusion account comes from experiments in which multiple choices or discriminations have been tested at the same time.
Cook and Rosen (2010) conducted an MSR task involving three different sample-choice pairings presented in different successive combinations across the two different portions of each session. By looking at the pattern of choice errors made to the different samples across a session, they could determine whether the pigeons were guessing at the transition point between the two tasks. If the transition reflected an absence of stimulus control, choice errors would be equally distributed among the incorrect alternatives regardless of the sample, the present task, or the stimulus assignments of the upcoming task. Alternatively, if the birds were controlled by the competing structure of each task, they would make choice errors that are specific to each sample organization at the time (i.e., each sample mapping onto the test stimuli) and possibly the upcoming organization of the sample-test mapping of the next segment. The evidence from the distribution of choice errors was unequivocal. Errors were far from equally distributed. For each sample during Task 1, the birds increasingly made errors only to the upcoming incorrect choice alternative linked to that sample in Task 2. Errors to the third “irrelevant” choice alternative never increased for a sample, despite that this same test alternative would be relevant at the same time for the other two samples. Thus, the anticipation errors prior to the reversal reflect specific competition caused by the increasing activation of the sample-test representations involved with the upcoming task, rather than any confusion about what to do. It appeared the birds were always engaged in one task or the other and not just choosing at random as predicted by a confusion account.
Further evidence against a confusion hypothesis comes from McMillan and Robert’s (2015) study. They tested pigeons with a variation of an MSR task in which three different discrimination tasks were programmed to occur successively during one-third of each session (i.e., Tasks 1, 2, and 3). Again, choice errors were not equally distributed across the alternatives as a function of time. In both visual (e.g., red, green, blue) and spatial (e.g., left, center, right) forms of the task, the anticipatory errors made prior to each task switch were directed toward the choices associated with the upcoming task or tasks in the sequence. The anticipatory and perseverative errors reflected competing control between the adjacent solutions to each task at the transition point in each session. Together, this type of choice evidence indicates that the sigmoidal pattern seen at the transition point mirrors the amount of competition between the adjacent tasks during the different portions of each session. Anticipatory errors thus represent the intrusion of the next task before a reversal, and perseverative errors reflect the continuing influence of the most recent task after the reversal.
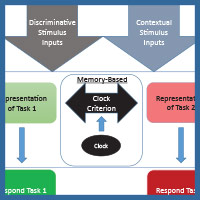
The diagram in Figure 4 shows one way to conceptualize the representations involved in MSR. The physical inputs on each trial are the discriminative visual or spatial stimuli critical to reward on any simple or conditional trial. These stimuli are tied to internal representations of the tasks and their learned solutions for each part of a session. These are symbolized as the separate representations that mediate behavior in Task 1 (e.g., depending on the experiment; red+, left+ or matching-like rules) and mediate behavior in Task 2 (e.g., green+, right+, or oddity-like rules). Successful activation and resolution of this information for each task provides the impetus for a motor action to a potentially correct stimulus. There are other potential external contextual stimulus inputs that could act as switching cues as well. These include the reinforcement of recent choices or external visual or spatial switching cues that could help the animal determine which portion of a session it might be in. In addition, and importantly, there is an internal clock that serves to support timing as a switching cue. This presumably reflects some form of an accumulator that is able to track the elapsed time within a session. Accumulation of time is thought to enter into a short-term memory value that is regularly compared with a learned clock criterion value held in long-term memory (although see Bizo and White [1994] for an alternative model of timing via reinforcement accumulation). The clock criterion value of the switch point is thought to be based on an aggregate of recently experienced temporal durations of reversals from recent sessions. During each session, the timed interval begins at the start of a session and ends once the task reversal occurs. This most recent value is averaged into the values from previous sessions, which form the basis of the criterion clock value. The output of this timing mechanism serves as the endogenous switching cue between the two tasks. The changing amount of activation between these two competing tasks, as mediated by time, is reflected in the sigmoidal switching function of MSR. From this combination of these cues, the internal competition between the two task representations and its resolution are at the core of MSR and its implications for understanding animal behavior.
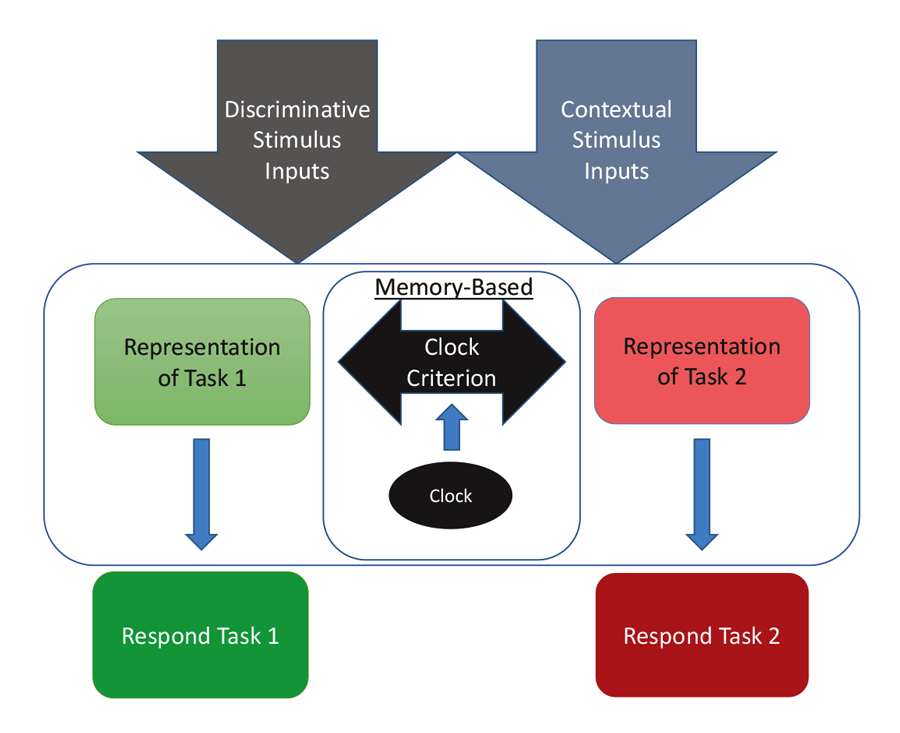
Figure 4. A model for how the two competing behaviors to Task 1 and Task 2 are represented based on input received from discriminative and contextual stimuli and the temporal clock that modulates behavioral choices over the session.
Can we better characterize the properties of this internal competition between the representational states that determine choice behavior? For instance, does the increased competition between the two tasks near the transition change how quickly animals respond across a session as measured by reaction time (RT)? RT could differ over the session if, for example, the increased competition near the reversal resulted in longer choice times. This lag could be due to a low level of discriminability or increased competition between the values of the two choice responses as compared with their stronger values at the session’s endpoints. Another possibility is that the simultaneous activation of both tasks near the reversal might result in faster responding on these trials. Here they might only need to encounter a single stimulus to make a choice as either stimulus might rapidly activate an independent representation, resulting in immediate responses to whichever stimulus was first encountered. Finally, RT may not be affected by the level of competition between the two tasks and therefore remain steady across the session.
Figure 5 shows choice RT data from two MSR experiments involving either a simple or a conditional discrimination. The simple discrimination results are derived from 40 post-acquisition sessions drawn from the experiments described in Rayburn-Reeves et al. (under review), and the conditional discrimination results come from the same sessions as reported in Experiment 1 in Cook and Rosen (2010). The overall pattern in both studies suggests that RT does not vary systematically in the way that behavioral choice changes across trials. Overall, the RT function across sessions from each study is generally flat, except for a slight “warm-up” effect at the beginning of a session. This effect was consistently seen across birds, suggesting that they needed a few trials to get into the more regular pattern of behavior seen for the remainder of the session. This effect may merit further research, as it may indicate a critical period where the processes controlling behavior from previous sessions are reactivated, or it could simply be that some pigeons would benefit from a period of darkness in the chamber prior to the start of the first trial in order to acclimate to the chamber. Further research would be needed to clarify this issue. In any case, the overall pattern of results support the idea that RT is not affected by the level of competition between the two tasks in the same way that behavioral choice is controlled.
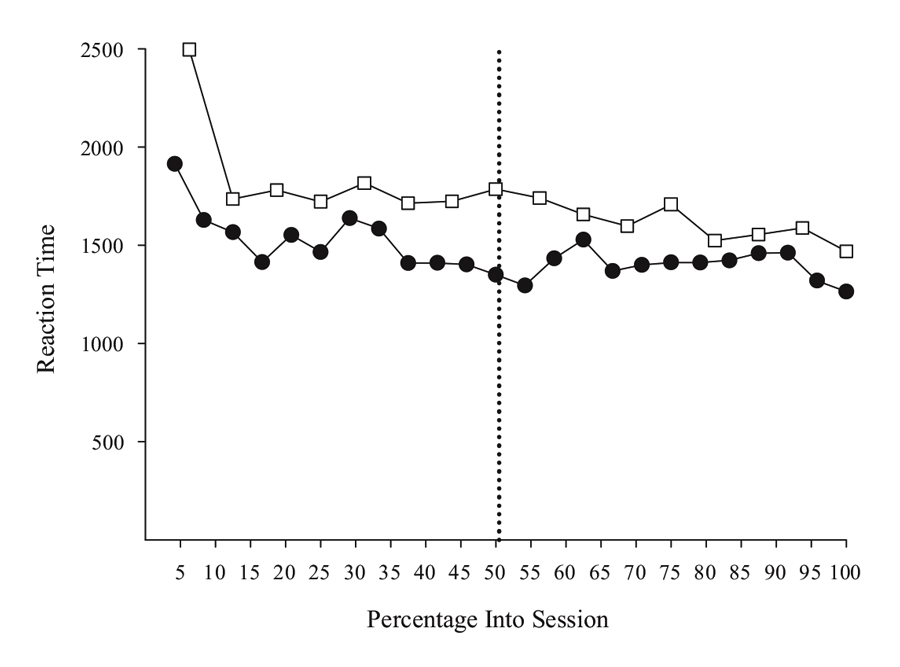
Figure 5. Reaction time for simple (open squares) and conditional (closed circles) MSR discriminations as a function of percentage into session. Simple discrimination data was taken from Rayburn-Reeves et al. (under review). Conditional discrimination RT data taken from Cook & Rosen (2010). The dotted line indicates the reversal location.
However, there were differences in RT among individual birds that might merit more investigation. One conditional bird did seem to slow down in making its test choices just after the reversal. This suggests there might be increased competition at this point. That said, this effect was not observed in the other two birds. Furthermore, the slower RTs for the simple discrimination in comparison to the conditional discrimination task also reflect one bird that was much slower than the others (although the overall function was still flat). Although more research is needed to clarify such details, the processes resolving the competition in the middle of the session seem to not dramatically affect or interfere with choice time. As a general rule, and aside from the warm-up effect, the birds appear to take approximately the same time to respond on a trial independent of the level of competition present between tasks.
Another central question about the competing nature of the two discriminations pivots around the nature of the averaged switching function’s sigmoidal shape. The shape of such averaged functions can stem from two different sources. First, the shape might represent the averaging of a collection of sessions in which the animal makes a single switch from performing Task 1 to Task 2. Presumably, because variability possibly affects both the estimation of accumulated time within a session and also the averaged time to the criterion duration, the temporal location of this “all-or-none” shift varies from session to session. Averaging these variable, single switch points across a number of sessions may produce the gradual transition seen during the midpoint of the session. A second possibility is that the middle part of the function represents a period of ongoing competition between the two tasks. Thus, there is an intermediate transition period where the relative activations of the two task representations overlap enough to cause a large number of alternating responses across the choice stimuli. This results in multiple switches across the tasks in each session. In this possibility, the sigmoidal shape of the average function is a direct representation of the degree of this competition within a single session.
The best way to examine these alternatives is to look at the behavior of individual birds from single sessions. Is a typical session characterized by a single switch from one task to the other task, or is it comprised of a region of multiple switches? Since each session might only contain a single switch or data point at the transition of each session, a large number of sessions from different animals is needed. As mentioned above, we had 40 post-acquisition sessions drawn from different experiments described in Rayburn-Reeves et al. (under review) that tested birds on a spatial MSR task for which we could analyze a considerable amount of single-session data. In these sessions, time was the only switching cue available, although these time-only sessions were embedded within ongoing sessions that had other external switching cues available. We examined only the time-only sessions for each bird to explore the question at hand.
We found evidence indicative of both single-switch and multiple-switch representations. Figure 6 depicts four single-session MSR performances from two of the four pigeons tested in Rayburn-Reeves et al. (under review). We selected these two birds because they each best represent the range of patterns observed. The left panel shows four representative sessions from one bird, #2L, that most frequently and regularly exhibited a single switch from responding Task 1 to Task 2 within a session. In the top leftmost panel, this bird made 42 consecutive choice responses to Task 1, followed by 38 successive choice responses to Task 2. This single switch sometimes came before or after, but always near, the reversal. The other three sessions depicted show a similar behavioral pattern. This pattern was typical for bird #2L. Approximately 67% of the sessions examined contained only one or two switches, suggesting this bird typically made a single action to switch. As a result, this pigeon’s anticipatory and perseverative errors stemmed from either switching too early or too late based on variations in its estimation of elapsed time. This bird’s representations of the two tasks across a session were likely quite separate and generated minimal competitive interference, allowing it to maintain long strings of the first and second task behaviors. This is depicted in the schematic at the bottom of Figure 6, which shows an initial region of choice behavior dominated by choice of Task 1, a smaller intermediate region where there is increasing overlap and competition in the control of responding between the two tasks, and a large terminal region where responses are strongly controlled by the choice of the second task.

Figure 6. Individual baseline session data for two pigeons taken from Rayburn-Reeves et al. (under review). Gray symbols indicate correct choices, with circles indicating choice of Task 1 and triangles indicating choice of Task 2. Red circles indicate perseverative errors on Task 1, while green triangles indicate anticipatory errors to Task 2. The dotted line indicates the reversal location.
The second pigeon, #1B, exhibited a different profile. This is depicted on the right side of Figure 6. In contrast to pigeon #2L, this bird showed a much larger intermediate period where there was considerable competition between the two task representations for control of behavior. In the top rightmost panel, this pigeon responded initially to the correct choice from Task 1, but then suffered a number of separate intrusions from Task 2 as it neared the reversal. After the reversal, there was also an extended period of perseveration from Task 1 before a final and terminal switch to Task 2. As can be seen in the figure, the other example sessions for this pigeon show similar patterns of multiple switches from Task 1 to Task 2 around the reversal. The various switches between responding to the two tasks are clearly temporally related, as they cluster towards the middle of the session. Unlike the first bird, this pigeon made two or fewer switches on only 17% of his sessions. This bird’s capacity to keep the two tasks separated was much poorer than the first bird’s and resulted in considerably more competition, especially in the middle of the session. The schematic at the bottom of Figure 6 captures this increased intermediate phase where the two tasks competed for behavior and smaller sections of strongly controlled behaviors at the session endpoints. The two other birds not shown from this experiment landed somewhere in between the patterns of the first and second bird. One bird from the experiment looked more similar to pigeon #2L, but with a few more tightly grouped switches per session. The other bird had an extended region of intermediate competing choices more like the second pigeon’s pattern, with a clear region of competition that was smaller in range, as it typically began making errors later and ending them earlier in a session.
From these results, it appears that MSR has three broad phases. The first and third are relatively extended segments at the beginning and end of each session where the animal is strongly controlled by either Task 1 or Task 2, respectively. This is determined by the clarity of the switching cue’s value. Between those phases is an intermediate phase where ongoing competition between the two tasks is much higher. The duration of this middle region seems to vary among birds depending on their approach to the task and their ability to segregate the two portions of the session.
We tried to capture the size of this intermediate phase of competition by looking at the trial locations where the first and last errors occurred within a session. This is not a perfect measure. Pigeons make errors that likely do not have much to do with competition (e.g., warm-up, mistaken actions, etc.). Thus, the first and last errors do not precisely mark the onset and offset of competition. Nonetheless, this easily computed measure does provide boundaries on the period over which the representations of each task and the mechanisms controlling responding to Task 1 and 2 appear simultaneously active. For the “single-switch” bird (#2L), the average of the last five sessions of the first error (average trial number = 32.2) and last error (average trial number = 40.8) occupied a small range (8.6 trials). The other bird (#1B), however, showed a wider range of 37.4 trials between the first error (average trial number = 17.0) and last error (average trial number = 54.4). These values were (59.0 − 33.4 = 25.6) and (50.4 − 22.8 = 27.6) for the two birds (#3M & #4G) that are not shown in Figure 6.
The above pattern indicates that animals in MSR typically engage in medium to long runs of Task 1 responses before beginning to suffer from anticipation interference from Task 2, followed by medium to long runs of Task 2 responses after an intermediate period of perseveration on Task 1. To capture the character of these two extended runs, we next analyzed the starting location within a session of where the longest run of correct responding to Task 1 and Task 2 occurred. We determined for each of the 40 sessions the trial where the longest sequence of correct responding started for both tasks. The resulting pattern is shown in Figure 7. This figure shows the relative frequency distribution of the starting trial position for the longest runs of Task 1 and for those of Task 2. The results show that the pigeons consistently begin responding correctly to Task 1 on Trial 1 or 2 and repeat this response for an extended period of the first half of the session. As can be seen in the figure, only infrequently did these runs start later than Trial 5 over this portion of the session (be observant of the break point on the y-axis). The results for Task 2 are more variable as might be expected given their later location in a session. The distribution of the longest Task 2 runs begins prior to and peaks just after the reversal location, reflecting the regular initiation of the longest Task 2 runs around the reversal. The greater variability in Task 2 run behavior may reflect greater cue competition than is present at the start of the session. At the reversal, animals have to deal with switching cue imprecision, memory for recent changes in outcomes, and competing memories for the long block of reinforced Task 1 choices. These challenges are never shared by the start requirements for Task 1 runs.
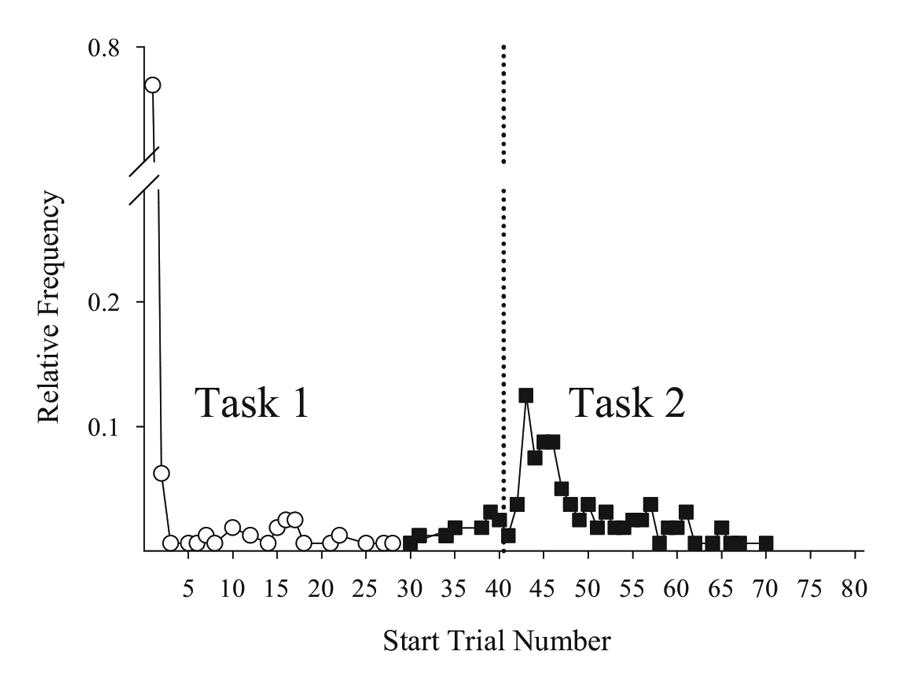
Figure 7. Frequency of the longest runs across sessions with corresponding trial number for which those runs started for Task 1 (open circles) and Task 2 (closed squares) responses. The y-axis includes a break point from .25−.71. All data were taken from Rayburn-Reeves et al. (under review). The dotted line indicates the reversal location.
Finally, in addition to examining long runs of each choice type, we also examined the distribution of starting locations of short runs. For this purpose, we defined short as runs of three or fewer trials of the same response. These types of runs likely represent the places within a session where relative activation and competition between the two task representations is greatest. Shown in Figure 8 is the relative frequency distribution of the starting location of all short runs recorded from all four birds. Consistent with the earlier analysis of MSR into three phases, this distribution has the expected highest accumulation of short runs in the middle of the session. As a direct reflection of these data, the greatest competition for control of action occurs during the transition between the tasks. This transition produces a greater amount of alternation between competing responses, although the level of competition does seem to vary among animals. There is also an interesting asymmetry in the distribution of short runs on either side of the reversal, with more short runs after the reversal than before. We believe this might come from differences of within- and between-session influences on responding. Before the reversal, the major source of competition comes from temporal anticipation of Task 2. The origins of this competition must come from the birds’ previous experience of when the reversal occurred during past sessions and the imprecision of measuring where they might be, temporally, in the current session. After the reversal, however, the birds seem to have a much greater degree of conflict as exhibited by the increased frequency of short runs. Besides the difficulties of temporal imprecision and their memory of the last several choices, there may be greater conflict created by the extended period of recently reinforced choices of Task 1 within the session. This increase in behavioral variability just after the reversal has been recently documented under changing reinforcement probability conditions, where a change from high to low rates of reinforcement occurs between the two halves of the session (Stahlman & Leising, 2016). Thus, perseveration errors likely have contributions from both within- (i.e., short-term and intermediate-term memories) and between-session (i.e., long-term memories) sources of experience. Anticipatory errors, on the other hand, stem from predominantly between-session representations or long-term memories. With MSR tasks, subjective differences in reinforcement probability might also occur at the endpoints of the session when the birds are good at each task. As these probabilities subjectively converge in the more challenging middle part of the session, pigeons might also begin dynamically exploring or sampling the two alternatives to a greater degree (Dunlap & Stephens, 2012; Lea, McLaren, Dow, & Graft, 2012). In the future, it will be interesting to see if the configurations of other MSR tasks result in the same properties of short and long run locations. For example, with more complex tasks, like conditional discriminations, the contributions of within-session experiences might produce greater levels of response competition and more short runs because of the mixed nature of reinforcement for both stimuli inherent in such discriminations.
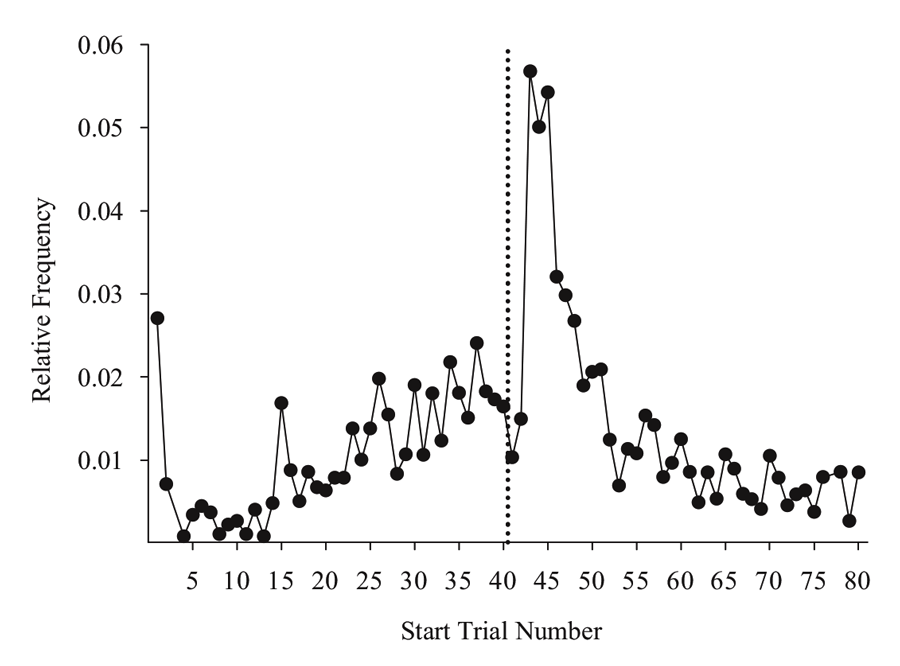
Figure 8. Relative frequency of short runs (i.e., runs < 4) as a function of trial number averaged across Tasks 1 and 2 for the last 40 sessions of training. Data taken from Experiments 1 and 2 of Rayburn-Reeves et al. (under review). The dotted line indicates the reversal location.
Summary
This paper integrates recent studies examining MSR and provides several new analyses of how internal and external sources of information compete for control of responding across a session. The MSR procedure is an excellent preparation for better understanding how animals organize time and order their sequential behavior, especially given the procedural simplicity of MSR. Animals in these tasks need to use and integrate two possibly different or independent sets of cues. One set is the traditional discriminative spatial and visual cues that have been regularly studied in discrimination learning settings for many years (Mackintosh, 1974; Shettleworth, 1998; Thorndike, 1898). The interesting twist in MSR is the introduction of the switching cue. This additional, critical cue allows the animals to emergently organize their behavior across a session to solve the competing demands of the reversed discrimination task. For pigeons, the results seem to indicate that temporal cues are the primary source of information for switching between the competing tasks, with use of this cue moderated by other factors like ITI length, stimulus dimension, and type of apparatus. Although several newer studies have illuminated how changes in task demands can modulate the degree of this temporal control (Daniel et al., 2015; McMillan et al., 2014; McMillan & Roberts, 2012; McMillan, Sturdy, Pisklak, Spetch, 2016; Rayburn-Reeves, Laude, et al., 2013; Rayburn-Reeves et al., under review), it is unclear why time has such a powerful influence on this species. Humans, and perhaps all mammals, appear to be far less influenced by time and more likely to attend to recent outcomes in guiding their switching behavior (Rayburn-Reeves et al., 2011; Rayburn-Reeves, Stagner, et al., 2013; A. P. Smith et al., 2016).
It is possible that this difference in performance on MSR reflects differences in the relative contribution of rule-governed and associative learning mechanisms between pigeons and humans and again, possibly other mammals (e.g., Ashby, Alfonso-Reese, Turken, & Waldron, 1998; Daw, Niv, & Dayan, 2005). In tests using Ashby et al.’s (1998) diagnostic procedures for isolating the contributions of these separate mechanisms, pigeons appear to rely on associative mechanisms in settings where humans easily use rule-based learning (J. D. Smith et al., 2011; J. D. Smith et al., 2012). If that is the case, the differences in the efficacy of different switching cues may reflect an extension of this division in MSR. Perhaps pigeons can only solve the relations between the two tasks using associative-based learning mechanisms that rely heavily on timing. Humans, on the other hand, can rapidly pick up on the rule-based organization of the task and use more executive functioning or rule-based mechanisms to solve this problem. It would be informative to test these different species with organizations of the task that would favor associative mechanisms over exclusive attention to rule-based information. One direction for future research will be to test various species to determine whether there are differences in how other species or classes of animals approach and solve this task. In this respect, triangulating research from behavioral ecology and neuroscience will likely provide a deeper understanding and basis for predicting various sources of information that regulate animal behavior over time. Understanding the differences in the natural ecology of various species, as well as assessing converging physiological changes in cognitive processing across species should provide a more complete picture of cue use in dynamic environments.
Another essential direction for future research stems from the different labels we have used to distinguish discriminative and switching cues. While useful for the purposes of presentation, analysis, and discussion, it is not clear that they are functionally different from the animal’s point of view. Consider time as a switching cue. Although time perception mediates how pigeons organize and partition their successful choice behaviors among the competing tasks, there are at least two broad classes of alternatives for thinking about its processing and contribution to the task. The first is that time is just another type of discriminative cue that is part of the entire complex of cues that determine each trial’s response. In this line of thinking, time acts as a discriminative cue to determine responding the same way color or location does. That is, the time-based switching cue is not fundamentally different in its role from other cues. Based on this theory, one could build a simple neural net model that could use time as an input along with the regular discriminative roles for spatial or visual inputs. The value and weighting of all these cues would then be calculated using the same associative rules. As a result, time would just be part of the vector of cues that determine momentary responding. Thus, the animal learns associatively to do the different behaviors at the right time depending on the input. Daniel Brooks, a post-doctoral fellow working in the Cook lab, has built such a model and it can readily produce the standard switching function seen in MSR (Brooks, personal communication).
The major alternative to the associative model of momentary choice is that the switching cue serves a hierarchical or modulatory function, acting more like a context cue than a discriminative cue (Cooper & Shallice, 2000; Monsell, 2003). In this case, the switching cue provides a context or occasion setter that helps the animal modulate use of one or the other task representations (Holland, 1992). Bouton (2007) has suggested that context-dependent shifts in behavior, similar to the ones considered here, are modulated by such additional inhibitory modifications. In the present case, the animals may well know how to independently perform both Task 1 and Task 2, but time or other switching cues serve to determine which specific behavior is expressed. At the moment, it is not possible to distinguish between these two broad classes of explanations. Whether switching cues in MSR are part of the associative complex that determines momentary responding across a session or instead they serve a modulatory, hierarchical, or contextual role in resolving different representations is another important research direction.
Even with these open questions, MSR remains an exciting new tool for studying how different learned behaviors, representations, or brain states compete to control behavior. In this vein, MSR has properties that are shared with the myriad of cue competition studies in Pavlovian settings, such as the effects of overshadowing and blocking. One advantage of MSR is that it allows repeated testing of the same competitive relation over many sessions rather than looking at the accumulation of sequential stages of training that regularly occurs in cue competition studies. It provides new and better opportunities for the dissection of the simultaneous activation of alternatively learned behaviors and, on a larger scale, competing brain states. How the brain resolves and organizes such competing states to produce a singular stream of actions is a fundamental question and one that is in need of more investigation (e.g., Daw et al., 2005; Dennett & Kinsbourne, 1992).
It is evident from the analyses considered above that there is an intermediate period of variable task competition in MSR that is regularly resolved by the animals. These resolution processes seem to cause no greater increase in processing time based on the amount of competition or level of task complexity, at least as measured by choice RT. Still further, these processes always seem to converge on selecting one of the two learned outcomes. The pigeons do not engage in other types of behaviors (i.e., guessing). Theoretically speaking, one of the most basic and valuable mechanisms that we use for the resolution among competing behaviors is associative strength (e.g., Pearce & Bouton, 2001; Rescorla & Wagner, 1972; Spence, 1936). The strongest value, association, or state at any one moment wins. This has and will continue to serve us well. It is almost certain that during the intermediate phase of MSR, the birds do not always “choose” the best alternative with the greatest overall strength (at least as computed across sessions). Instead, momentary within-session influences aside from associative strength must be causing the birds to select less “optimal” behaviors. MSR thus provides a new vehicle for dissecting such long-term and short-term influences as they can be regularly and repeatedly produced in this setting. As a result, we can analyze in detail why and how animals make the specific choices they do at a particular moment in time. This new capacity to regularly produce competition between different task activations makes MSR a powerful tool for helping us better understand how animals organize and select their ongoing behavior.
References
Andreasen, N. C., Paradiso, S., & O’Leary, D. S. (1998). “Cognitive dysmetria” as an integrative theory of schizophrenia: A dysfunction in cortical-subcortical-cerebellar circuitry? Schizophrenia Bulletin, 24, 203–218. doi:10.1093/oxfordjournals.schbul.a033321
Antle, M. C., & Silver, R. (2009). Neural basis of timing and anticipatory behaviors. The European Journal of Neuroscience, 30, 1643–1649. doi:10.1111/j.1460-9568.2009.06959.x
Ashby, F. G., Alfonso-Reese, L. A., Turken, A. U., & Waldron, E. M. (1998). A neuropsychological theory of multiple systems in category learning. Psychological Review, 105, 442–481. doi:10.1037/0033-295X.105.3.442
Barkley, R. A. (1997). Attention-deficit/hyperactivity disorder, self-regulation, and time: Toward a more comprehensive theory. Journal of Developmental & Behavioral Pediatrics, 18, 271–279. doi:10.1097/00004703-199708000-00009
Bitterman, M. E. (1965). Phyletic differences in learning. American Psychologist, 20, 396–410. doi:10.1037/h0022328
Bitterman, M. E. (1975). The comparative analysis of learning. Science, 188, 699–709. doi:10.1126/science.188.4189.699
Bizo, L. A., & White, K. G. (1994). The behavioral theory of timing: Reinforcer rate determines pacemaker rate. Journal of the Experimental Analysis of Behavior, 61, 19–33. doi:10.1901/jeab.1994.61-19
Bodily, K. D., Katz, J. S., & Wright, A. A. (2008). Matching-to-sample abstract-concept learning by pigeons. Journal of Experimental Psychology: Animal Behavior Processes, 34, 178-184. doi:10.1037/0097-7403.34.1.178
Bouton, M. E. (2004). Context and behavioral processes in extinction. Learning & Memory, 11, 485–494. doi:10.1101/lm.78804
Brushfield, A. M., Luu, T. T., Callahan, B. D., & Gilbert, P. E. (2008). A comparison of discrimination and reversal learning for olfactory and visual stimuli in aged rats. Behavioral Neuroscience, 122, 54–62. doi:10.1037/0735-7044.122.1.54
Buhusi, C. V., & Meck, W. H. (2005). What makes us tick? Functional and neural mechanisms of interval timing. Nature Reviews Neuroscience, 6, 755–765. doi:10.1038/nrn1764
Cheng, K., & Roberts, W. A. (1989). Timing multimodal events in pigeons. Journal of the Experimental Analysis of Behavior, 52, 363–376. doi:10.1901/jeab.1989.52-363
Cheng, K., & Roberts, W. A. (1991). Three psychophysical principles of timing in pigeons. Learning & Motivation, 22, 112–128. doi:10.1016/0023-9690(91)90019-5
Cook, R. G., & Rosen, H. A. (2010). Temporal control of internal states in pigeons. Psychonomic Bulletin & Review, 17, 915–922. doi:10.3758/PBR.17.6.915
Cook, R. G., & Wasserman, E. A. (2006). Relational discrimination learning in pigeons. In E. A. Wasserman & T. R. Zentall (Eds.), Comparative Cognition: Experimental Explorations of Animal Intelligence, 307–324. London: Oxford University Press.
Cooper, R., & Shallice, T. (2000). Contention scheduling and the control of routine activities. Cognitive Neuropsychology, 17, 297–338. doi:10.1080/026432900380427
Daniel, T. A., Cook, R. G., & Katz, J. S. (2015). Temporal dynamics of task switching and abstract-concept learning in pigeons. Frontiers in Psychology, 6: 1334. doi:10.3389/fpsyg.2015.01334
Daw, N. D., Niv, Y., & Dayan, P. (2005). Uncertainty-based competition between prefrontal and dorsolateral striatal systems for behavioral control. Nature Neuroscience, 8, 1704–1711. doi:10.1038/nn1560
Dennett, D. C., & Kinsbourne, M. (1992). Time and the observer: The where and when of consciousness in the brain. Behavioral and Brain Sciences, 15, 183–247. doi:10.1017/S0140525X00068229
Dudchenko, P. A. (2004). An overview of the tasks used to test working memory in rodents. Neuroscience & Biobehavioral Reviews, 28, 699–709. doi:10.1016/j.neubiorev.2004.09.002
Dunlap, A. S., & Stephens, D. W. (2012). Tracking a changing environment: Optimal sampling, adaptive memory and overnight effects. Behavioural Processes, 89, 86–94. doi:10.1016/j.beproc.2011.10.005
Egger, M. D., & Miller, N. E. (1962). Secondary reinforcement in rats as a function of information value and reliability of the stimulus. Journal of Experimental Psychology, 64, 97–104. doi:10.1037/h0040364
Evenden, J. L., & Robbins, T. W. (1984). Win-stay behaviour in the rat. The Quarterly Journal of Experimental Psychology Section B: Comparative and Physiological Psychology, 36, 1–26. doi:10.1080/14640748408402190
Holland, P. C. (1992). Occasion setting in Pavlovian conditioning. The Psychology of Learning and Motivation, 28, 69–125. doi:10.1016/S0079-7421(08)60488-0
Katz, J. S., & Wright, A. A. (2006). Same/different abstract-concept learning by pigeons. Journal of Experimental Psychology: Animal Behavior Processes, 32, 80–86. doi:10.1037/0097-7403.32.1.80
Lashley, K. S. (1951). The problem of serial order in behavior. In L. A. Jeffress (Ed.), Cerebral Mechanisms in Behavior, 112–136. New York: John Wiley & Sons.
Laude, J. R., Stagner, J. P., Rayburn-Reeves, R. M., & Zentall, T. R. (2014). Midsession reversals with pigeons: Visual versus spatial discriminations and the intertrial interval. Learning & Behavior, 42, 40–46. doi:10.3758/s13420-013-0122-x
Lea, S. E. G., McLaren, I. P. L., Dow, S. M., & Graft, D. A. (2012). The cognitive mechanisms of optimal sampling. Behavioural Processes, 89, 77–85. doi:10.1016/j.beproc.2011.10.004
Levine, M. (1975). A Cognitive Theory of Learning: Research on Hypothesis Testing. Oxford, UK: Lawrence Erlbaum.
Lewis, P. A., & Miall, R. C. (2006). Remembering the time: A continuous clock. Trends in Cognitive Science, 10, 401–406. doi:10.1016/j.tics.2006.07.006
Mackintosh, N. J. (1974). The Psychology of Animal Learning. New York: Academic Press.
Mackintosh, N. J. (1975). A theory of attention: variations in the associability of stimuli with reinforcement. Psychological Review, 82, 276–298. doi:10.1037/h0076778
Mackintosh, N. J., & Cauty, A. (1971). Spatial reversal learning in rats, pigeons, and goldfish. Psychonomic Science, 22, 281–282. doi:10.3758/BF03335956
Martin, B., Giersch, A., Huron, C., & van Wassenhove, V. (2013). Temporal event structure and timing in schizophrenia: Preserved binding in a longer “now”. Neuropsychologia, 51, 358–371. doi:10.1016/j.neuropsychologia.2012.07.002
Matell, M. S., & Meck, W. H. (2000). Neuropsychological mechanisms of interval timing behavior. Bioessays, 22, 94–103. doi:10.1002/(SICI)1521-1878(200001)22:1<94::AID-BIES14>3.0.CO;2-E
McMillan, N., Kirk, C. R., & Roberts, W. A. (2014). Pigeon (Columba livia) and rat (Rattus norvegicus) performance in the midsession reversal procedure depends upon cue dimensionality. Journal of Comparative Psychology, 128, 357–366. doi:10.1037/a0036562
McMillan, N., & Roberts, W. A. (2012). Pigeons make errors as a result of interval timing in a visual, but not a visual-spatial, midsession reversal task. Journal of Experimental Psychology: Animal Behavior Processes, 38, 440. doi:10.1037/a0030192
McMillan, N., & Roberts, W. A. (2013). Interval timing under variations in the relative validity of temporal cues. Journal of Experimental Psychology: Animal Behavior Processes, 39, 334–341. doi:10.1037/a0032470
McMillan, N., & Roberts, W. A. (2015). A three-stimulus midsession reversal task in pigeons with visual and spatial discriminative stimuli. Animal Cognition, 18, 373–383. doi:10.1007/s10071-014-0808-2
McMillan, N., Sturdy, C. B., Pisklak, J. M., & Spetch, M. L. (2016). Pigeons perform poorly on a midsession reversal task without rigid temporal regularity. Animal Cognition Epub, 1–5.. doi:10.1007/s10071-016-0962-9
McMillan, N., Sturdy, C. B., & Spetch, M. L. (2015). When is a choice not a choice? Pigeons fail to inhibit incorrect responses on a go/no-go midsession reversal task. Journal of Experimental Psychology: Animal Learning and Cognition, 41, 255–265. doi:10.1037/xan0000058
Meck, W. H., & Church, R. M. (1983). A mode control model of counting and timing processes. Journal of Experimental Psychology: Animal Behavior Processes, 9, 320–334. doi:10.1037/0097-7403.9.3.320
Miller, R. R., & Barnet, R. C. (1993). The role of time in elementary associations. Current Directions in Psychological Science, 2, 106–111. doi:10.1111/1467-8721.ep10772577
Monsell, S. (2003). Task switching. Trends in Cognitive Sciences, 7, 134–140. doi:10.1016/S1364-6613(03)00028-7
Pearce, J. M., & Bouton, M. E. (2001). Theories of associative learning in animals. Annual Review of Psychology, 52, 111–139. doi:10.1146/annurev.psych.52.1.111
Rayburn-Reeves, R. M., Laude, J. R., & Zentall, T. R. (2013). Pigeons show near-optimal win-stay/lose-shift performance on a simultaneous-discrimination, midsession reversal task with short intertrial intervals. Behavioural Processes, 92, 65–70. doi:10.1016/j.beproc.2012.10.011
Rayburn-Reeves, R. M., Molet, M., & Zentall, T. R. (2011). Simultaneous discrimination reversal learning in pigeons and humans: Anticipatory and perseverative errors. Learning & Behavior, 39, 125–137. doi:10.3758/s13420-010-0011-5
Rayburn-Reeves, R. M., Qadri, M. A. J., Brooks, D. I., Keller, A. M., & Cook, R. G. (under review). Dynamic cue use by pigeons in a midsession reversal task. Behavioural Processes.
Rayburn–Reeves, R. M., Stagner, J. P., Kirk, C. R., & Zentall, T. R. (2013). Reversal learning in rats (Rattus norvegicus) and pigeons (Columba livia): Qualitative differences in behavioral flexibility. Journal of Comparative Psychology, 127, 202–211. doi:10.1037/a0026311
Rayburn-Reeves, R. M., & Zentall, T. R. (2013). Pigeons use of cues in a repeated 5-trial sequence, single reversal task. Learning & Behavior, 41, 138–147. doi:10.3758/s13420-012-0091-5
Rescorla, R., & Wagner, A. R. (1972). A theory of Pavlovian conditioning. Variations in the effectiveness of reinforcement and nonreinforcement. In A. H. Black & W. F. Prokasy (Eds.), Classical Conditioning II: Current Research and Theory. New York: Appleton-Century-Crofts.
Restle, F. (1962). The selection of strategies in cue learning. Psychological Review, 69, 329–343. doi:10.1037/h0044672
Roberts, S. (1981). Isolation of an internal clock. Journal of Experimental Psychology: Animal Behavior Processes, 7, 242–268. doi:10.1037/0097-7403.7.3.242
Shettleworth, S. J. (1998). Cognition, Evolution, and Behavior. New York: Oxford University Press.
Slotnick, B. (1984). Olfactory stimulus control in the rat. Chemical Senses, 9, 157–165. doi:10.1093/chemse/9.2.157
Smith, A. P., Pattison, K. F., & Zentall, T. R. (2016). Rats’ midsession reversal performance: The nature of the response. Learning & Behavior, 44, 49–58. doi:10.3758/s13420-015-0189-7
Smith, J. D., Ashby, F. G., Berg, M. E., Murphy, M. S., Spiering, B., Cook, R. G., & Grace, R. C. (2011). Pigeons’ categorization may be exclusively nonanalytic. Psychonomic Bulletin & Review, 18, 414–421. doi:10.3758/s13423-010-0047-8
Smith, J. D., Berg, M. E., Cook, R. G., Murphy, M. S., Crossley, M. J., Boomer, J., . . . Grace, R. C. (2012). Implicit and explicit categorization: A tale of four species. Neuroscience & Biobehavioral Reviews, 36, 2355–2369. doi:10.1016/j.neubiorev.2012.09.003
Spence, K. W. (1936). The nature of discrimination learning in animals. Psychological Review, 43, 427–449. doi:10.1037/h0056975
Staddon, J., & Higa, J. (1999). Time and memory: Towards a pacemaker-free theory of interval timing. Journal of the Experimental Analysis of Behavior, 71, 215–251. doi:10.1901/jeab.1999.71-215
Stahlman, W. D., & Leising, K. J. (2016). Midsession shifts in reward probability and the control of behavioral variability. Learning & Behavior, 1-13. doi:10.3758/s13420-016-0211-8
Thorndike, E. L. (1898). Animal intelligence: An experimental study of the associative processes in animals. Psychological Monographs: General and Applied. doi:10.1037/10780-000
Tinklepaugh, O. L. (1928). An experimental study of representative factors in monkeys. Journal of Comparative Psychology, 8, 197–236. doi:10.1037/h0075798
Vicario, C. M. (2013). Cognitively controlled timing and executive functions develop in parallel? A glimpse on childhood research. Frontiers in Behavioral Neuroscience, 7, 1–4. doi:10.3389/fnbeh.2013.00146
Wasserman, E. A., Kiedinger, R. E., & Bhatt, R. S. (1988). Conceptual behavior in pigeons: Categories, subcategories, and pseudocategories. Journal of Experimental Psychology: Animal Behavior Processes, 14, 235–246. doi:10.1037//0097-7403.14.3.235
Wilkie, D. M. (1995). Time-place learning. Current Directions in Psychological Science, 4, 85–89. doi:10.1111/1467-8721.ep10772332
Wilkie, D. M., & Willson, R. J. (1992). Time-place learning by pigeons, Columba livia. Journal of the Experimental Analysis of Behavior, 57, 145–158. doi:10.1901/jeab.1992.57-145
Wright, A. A., Cook, R. G., Rivera, J. J., Sands, S. F., & Delius, J. D. (1988). Concept learning by pigeons: Matching-to-sample with trial-unique video picture stimuli. Animal Learning & Behavior, 16, 436–444. doi:10.3758/Bf03209384
 What Can Nest-Building Birds Teach Us?
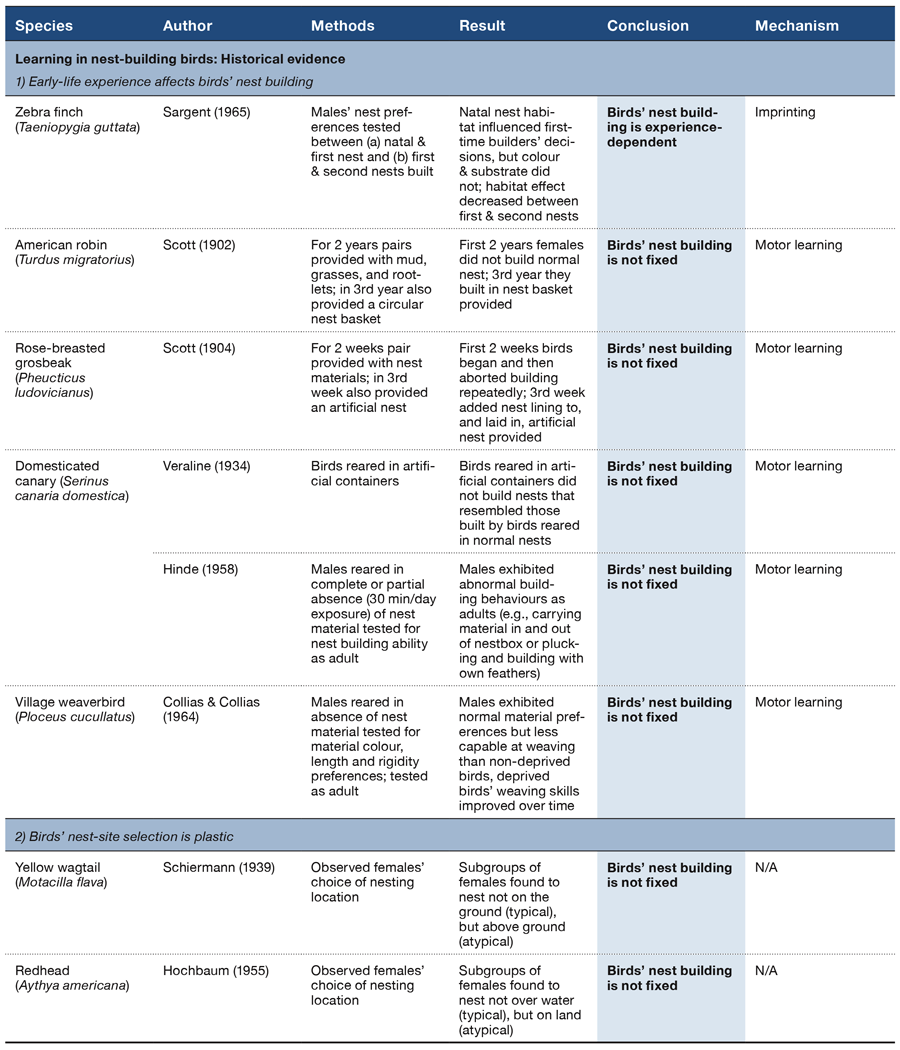
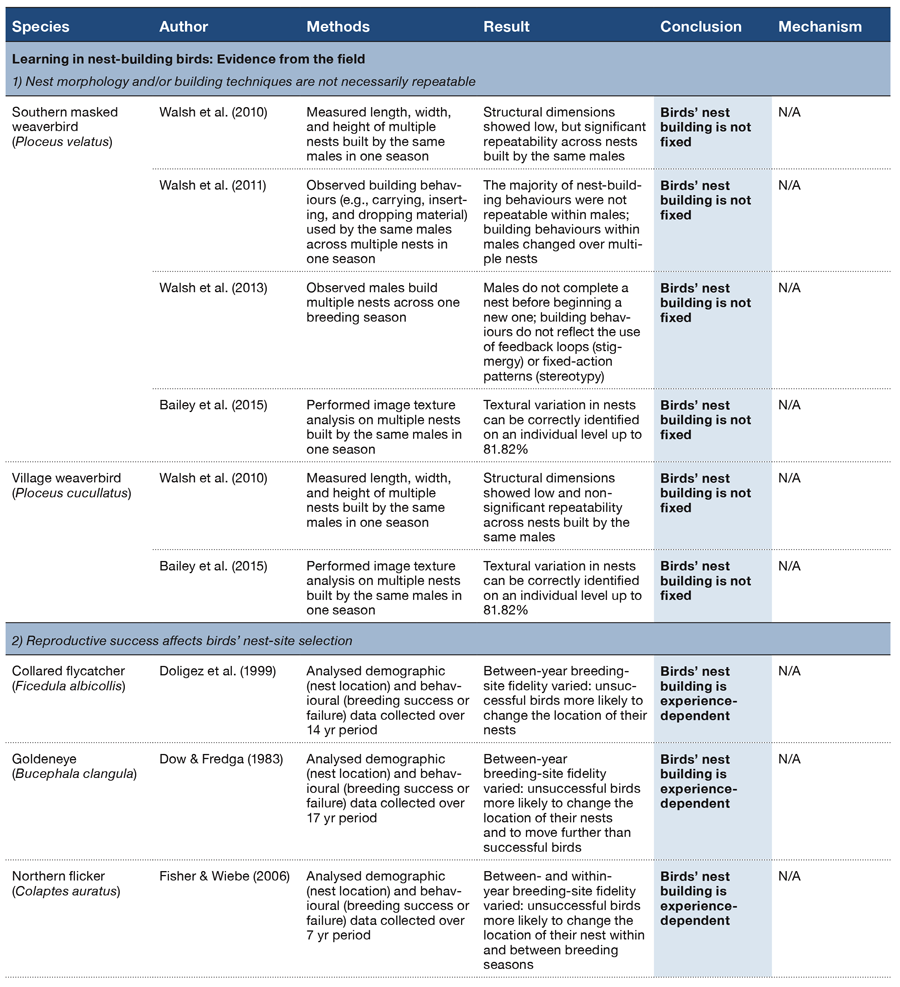
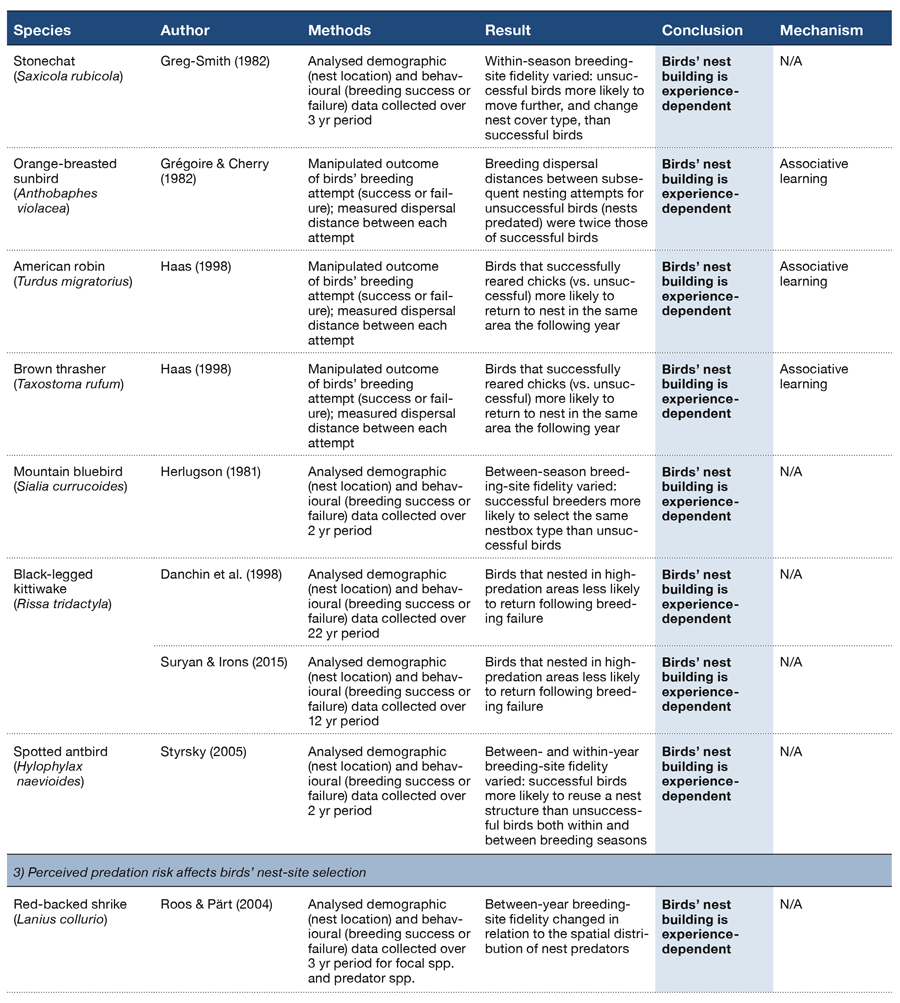
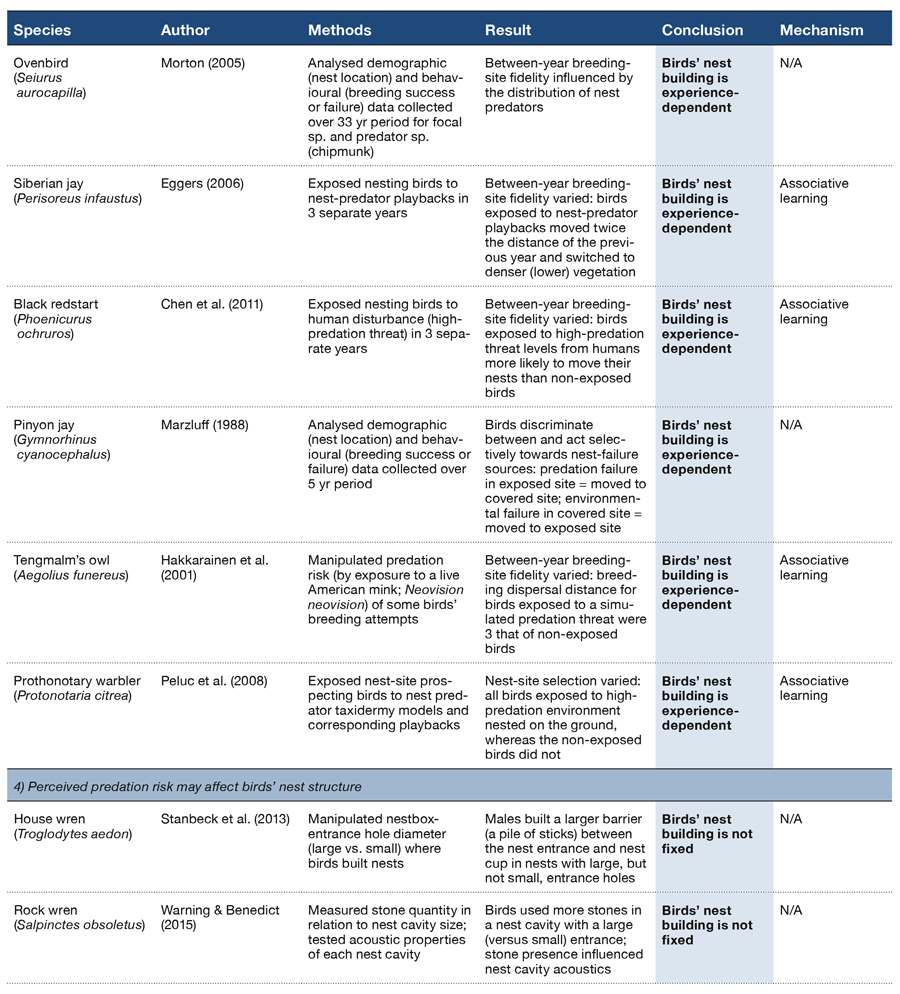
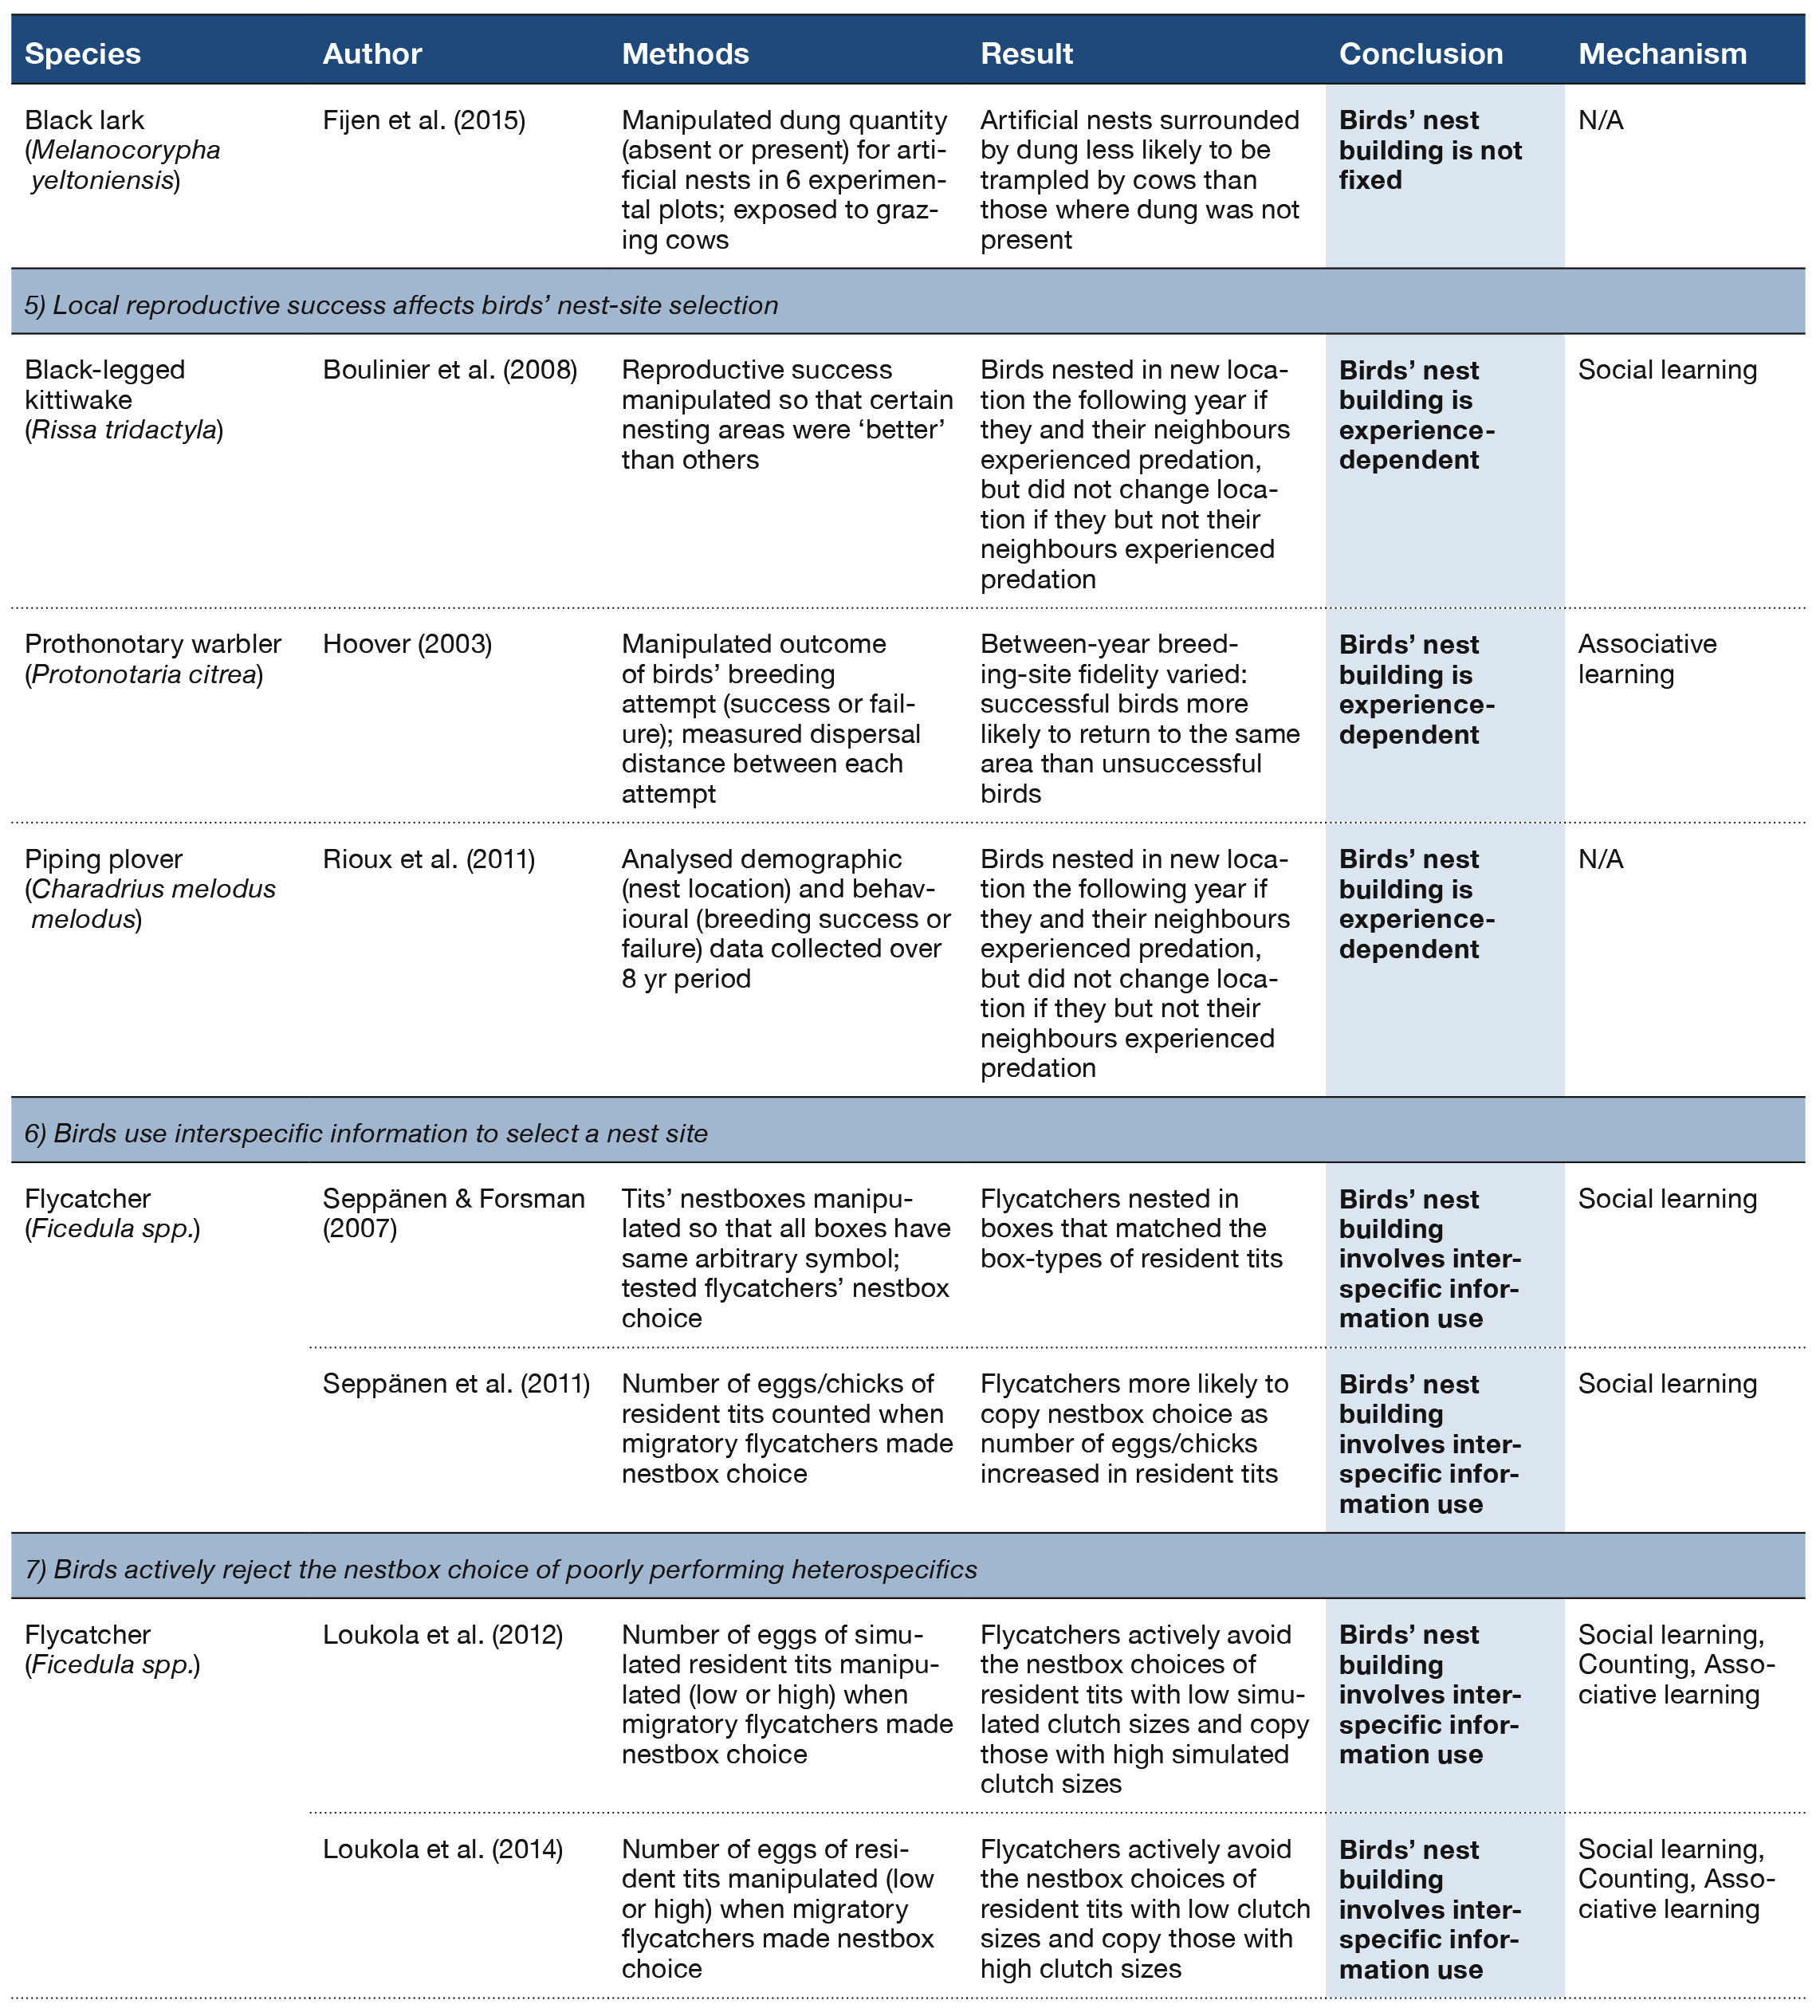
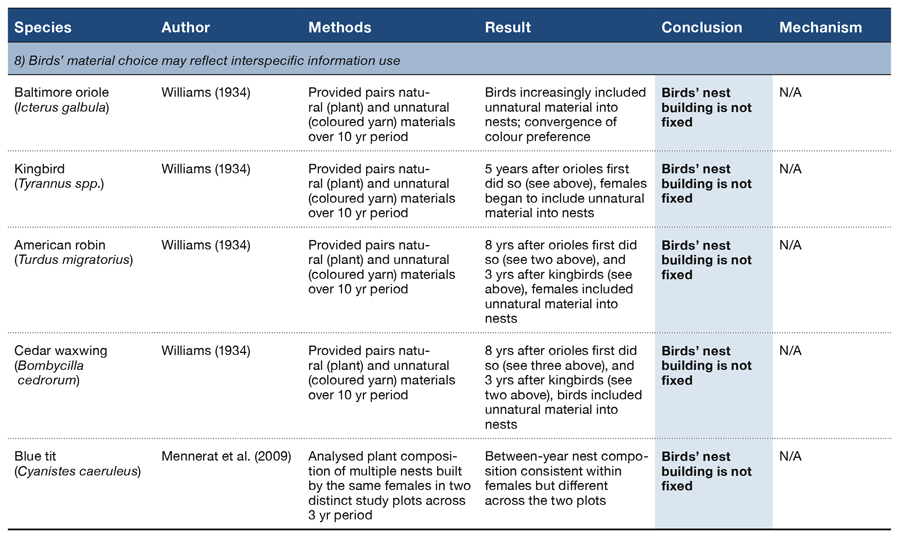
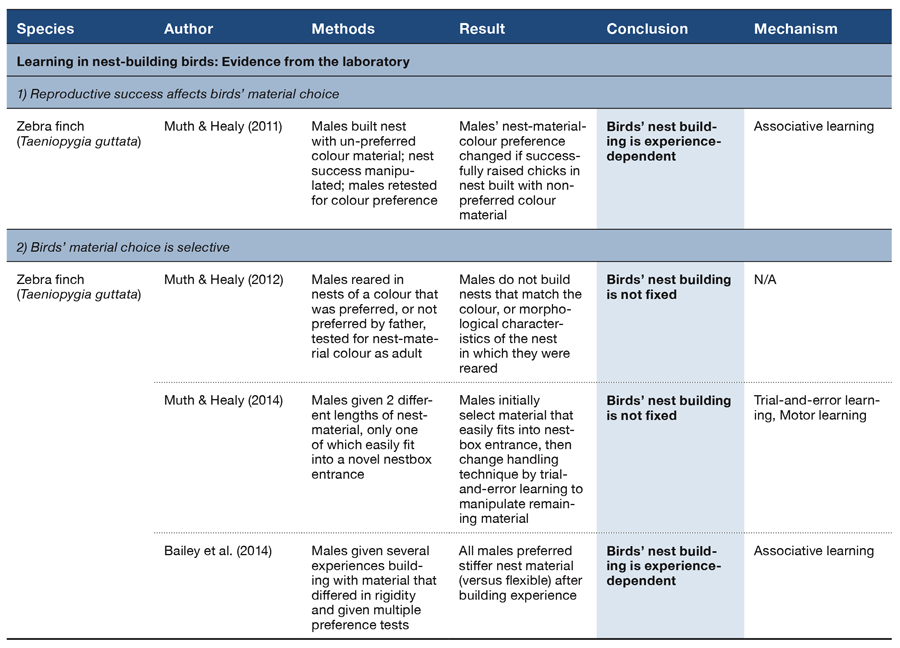
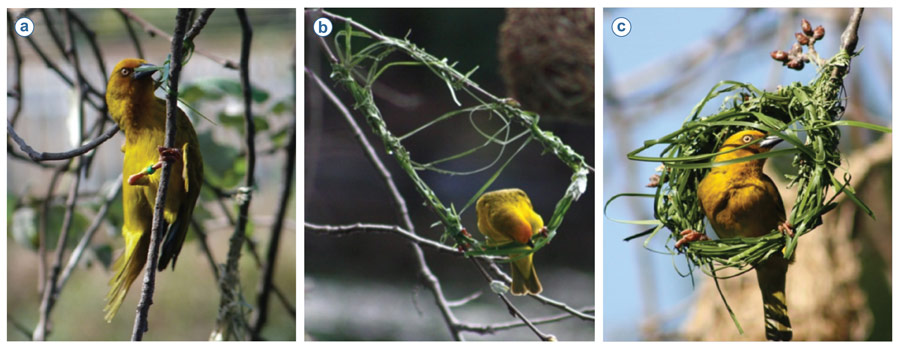
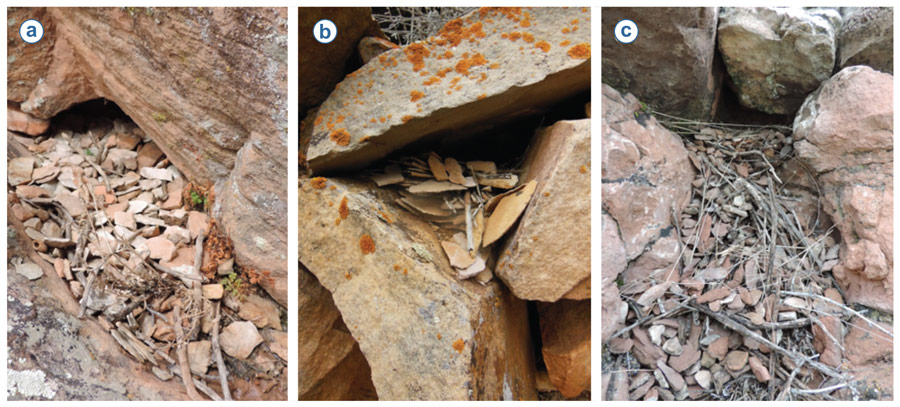

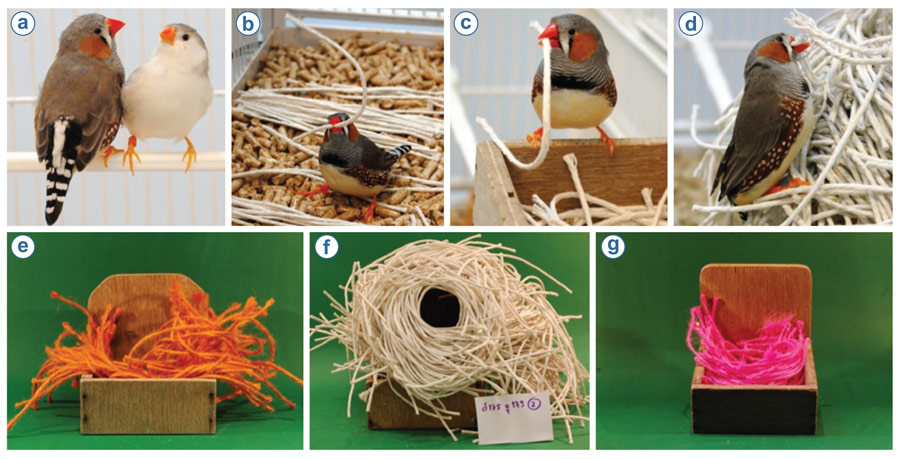
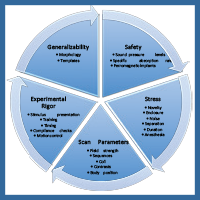 Functional Magnetic Resonance Imaging of the Domestic Dog: Research, Methodology, and Conceptual Issues
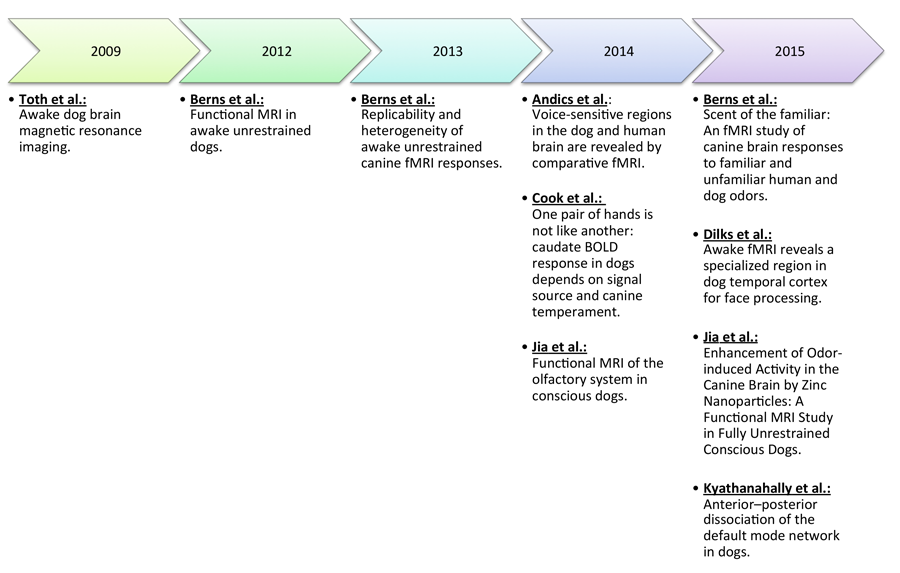
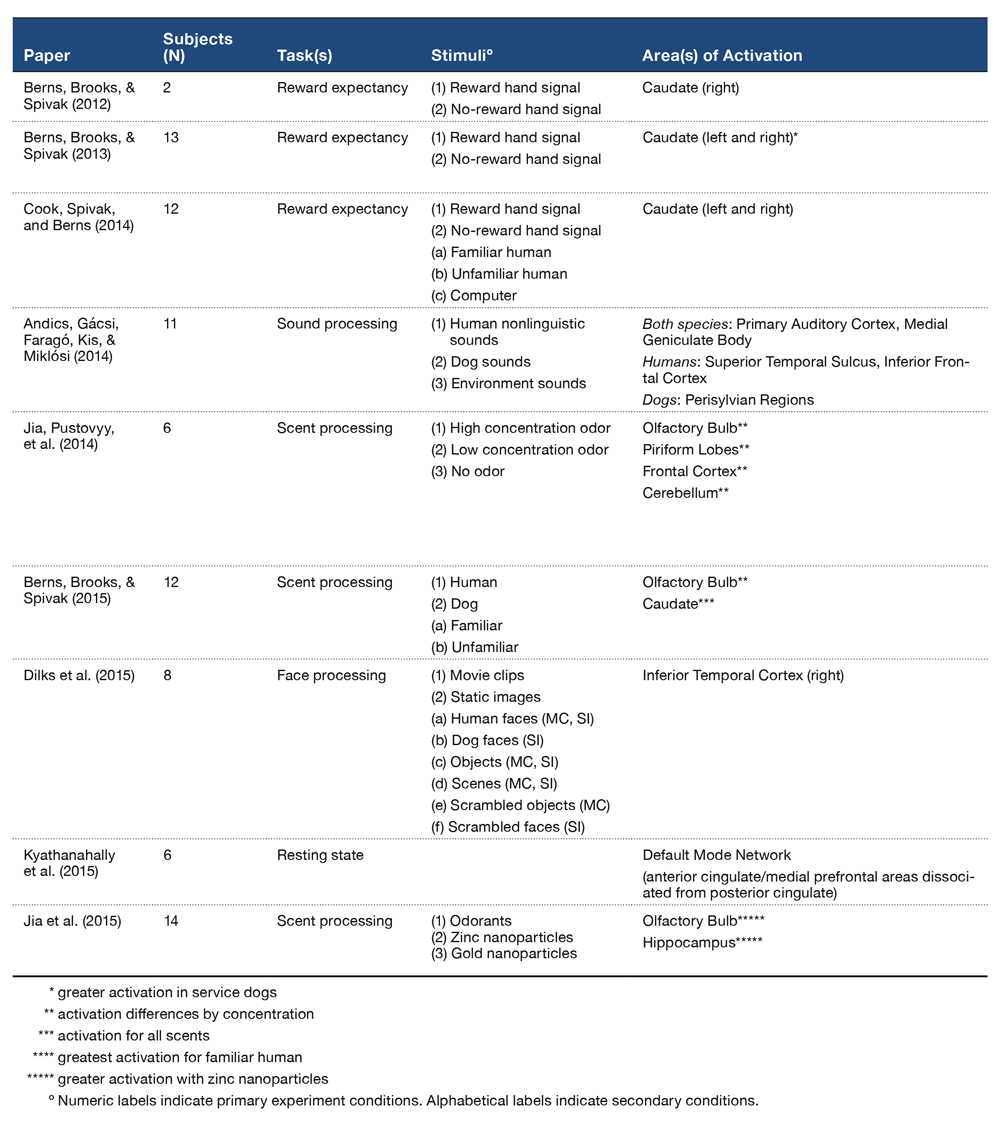
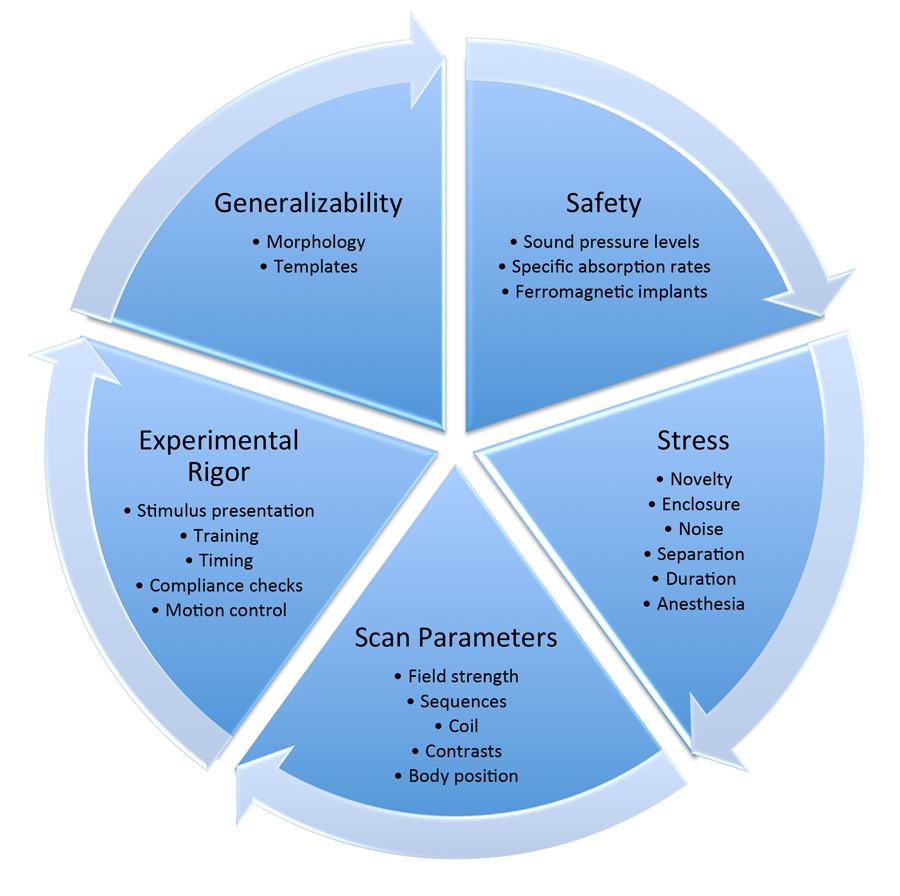
 Comparative Cognition Outside the Laboratory
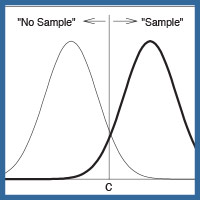 From the Pigeon Lab to the Courtroom
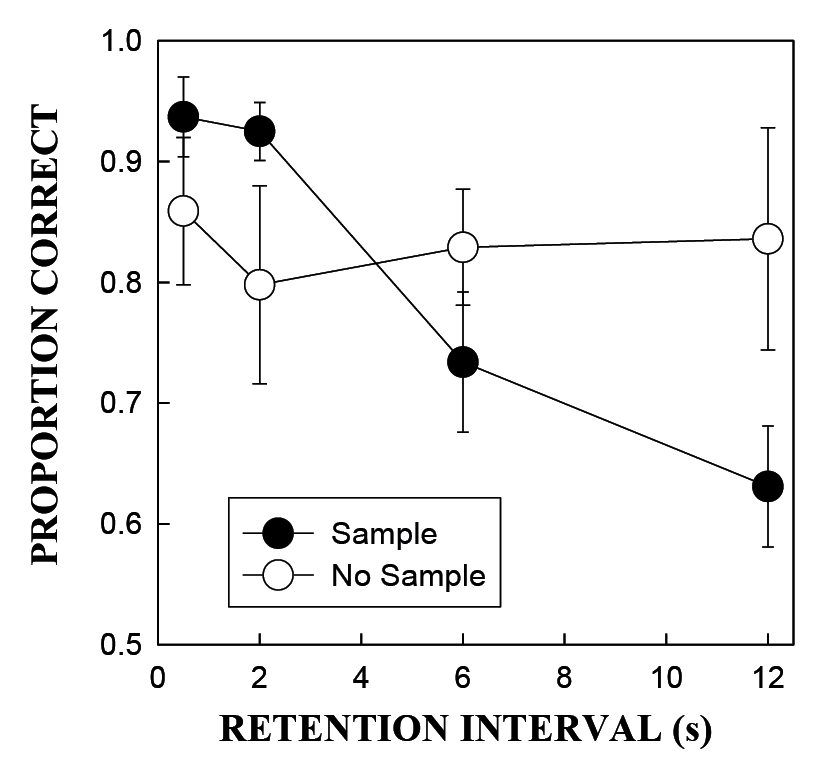
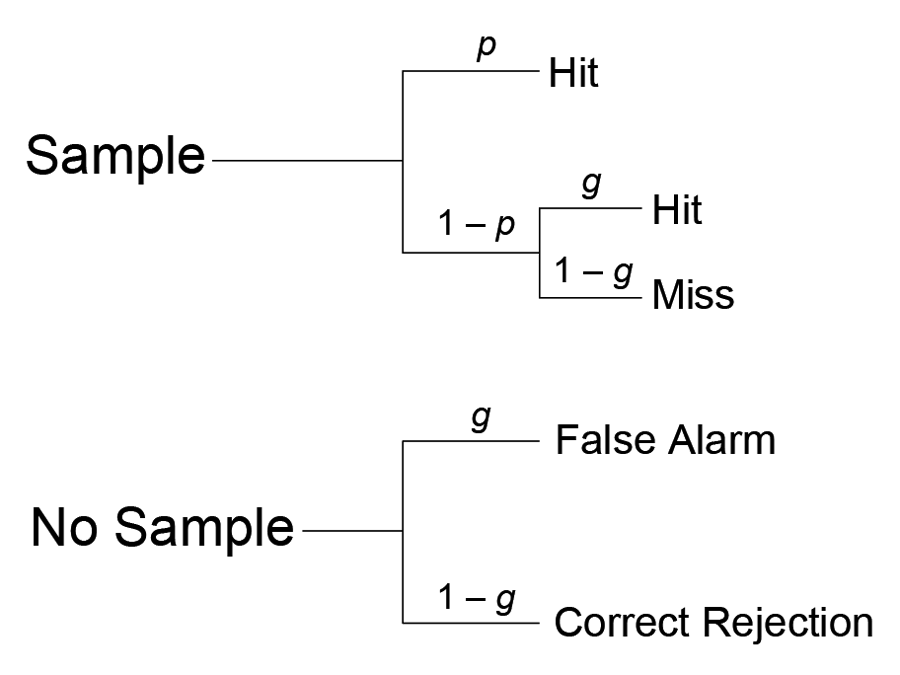

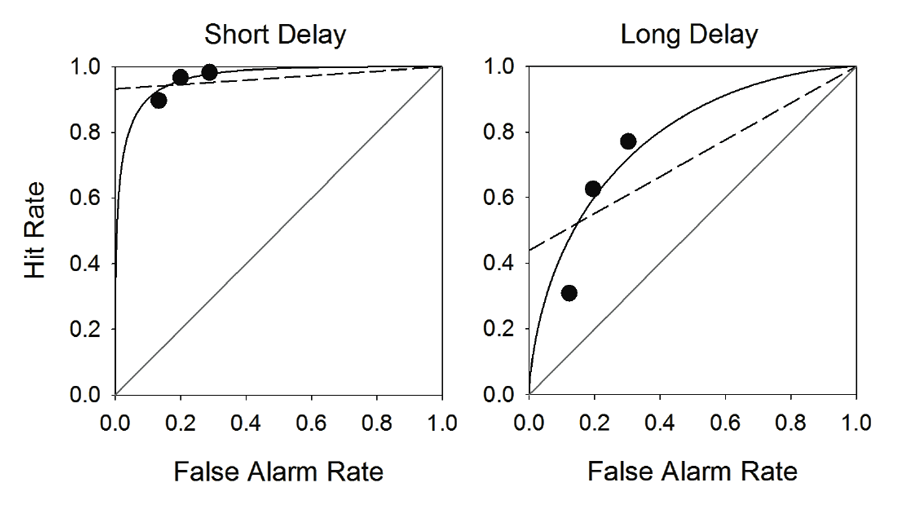
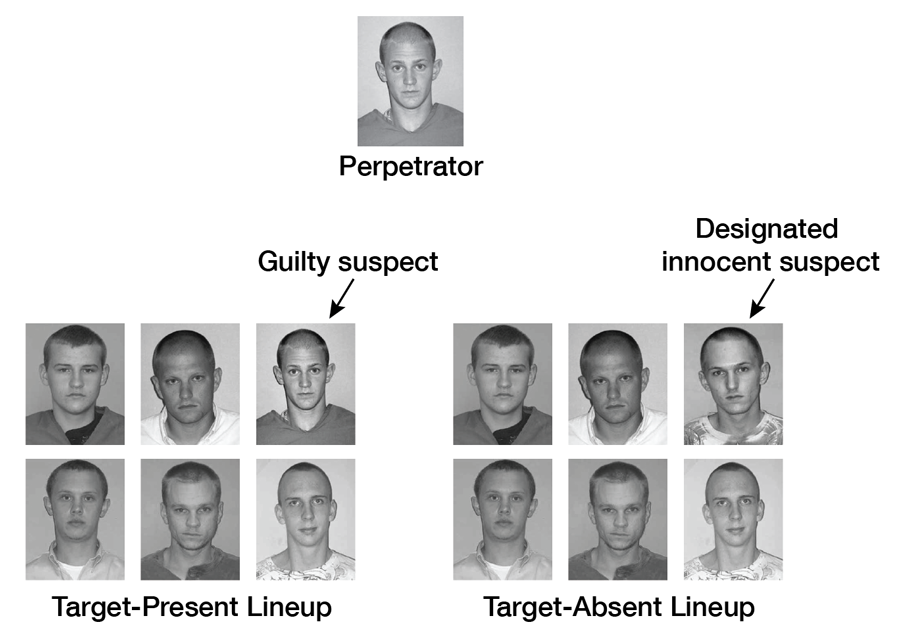
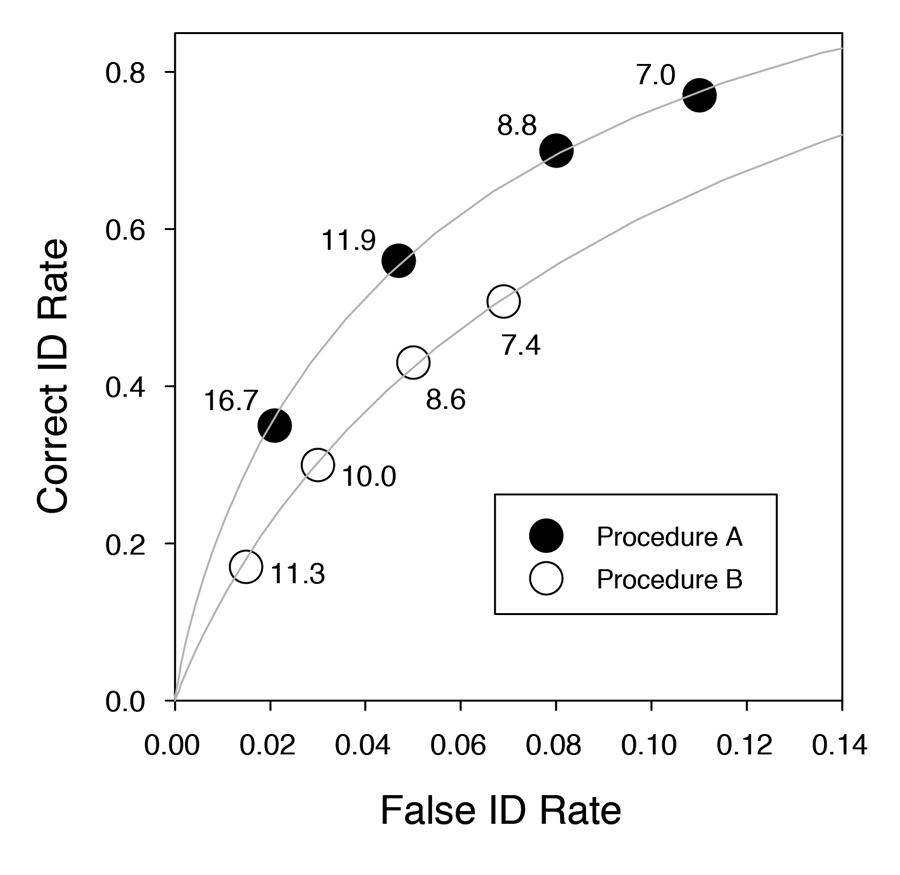
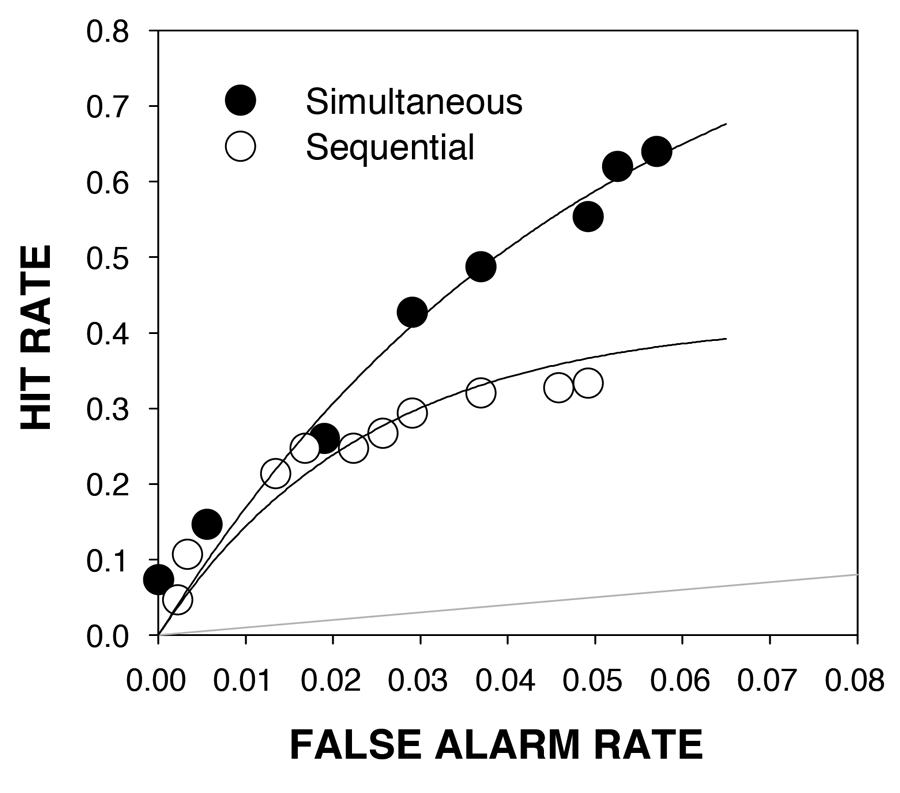
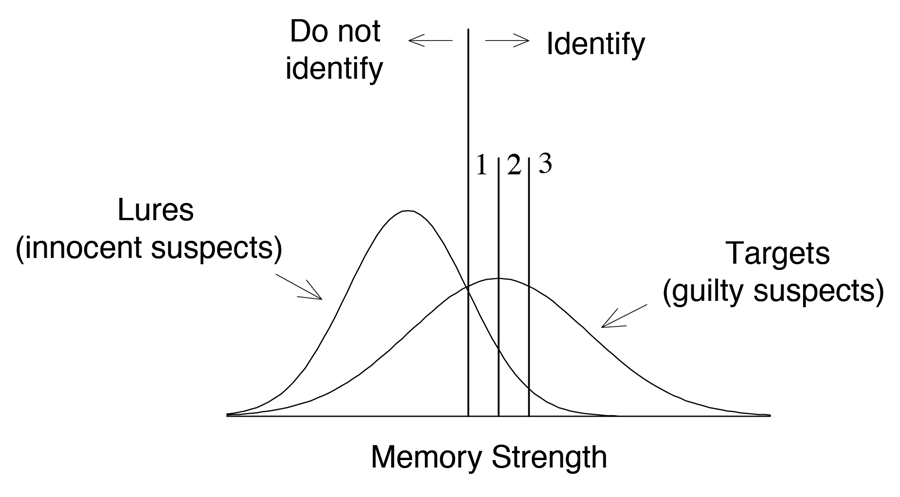
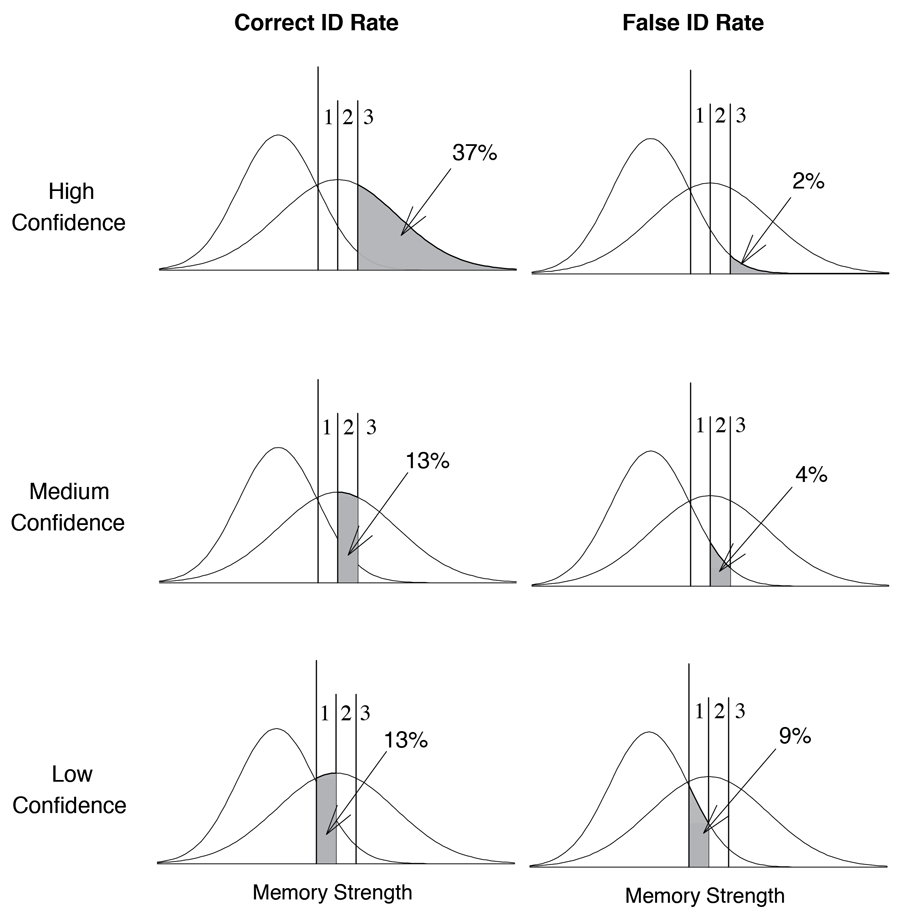
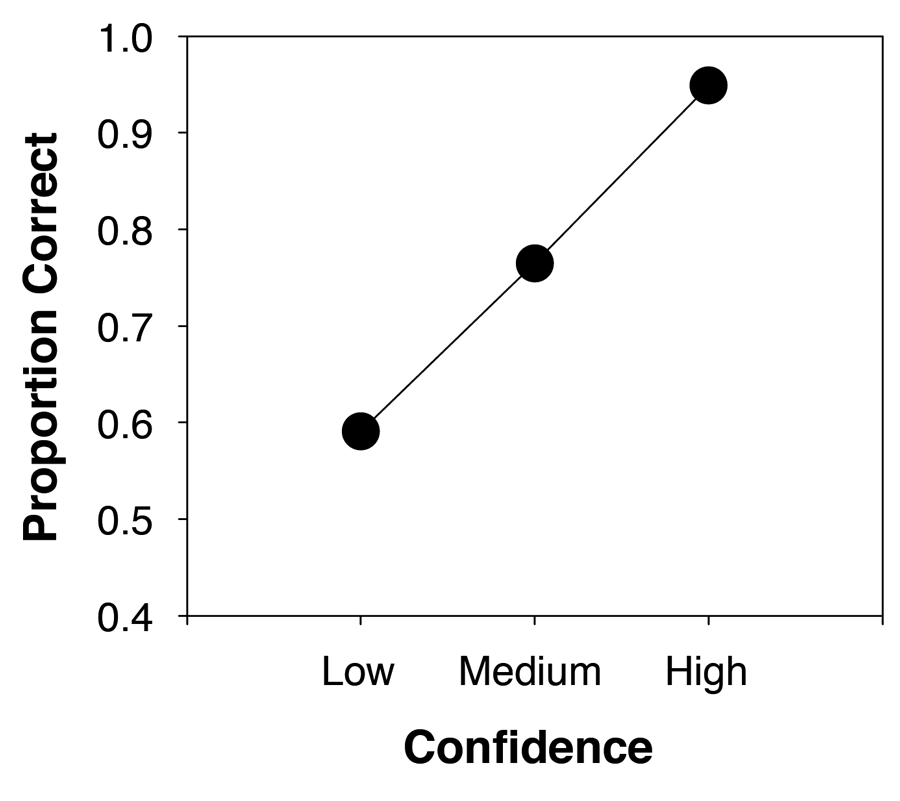
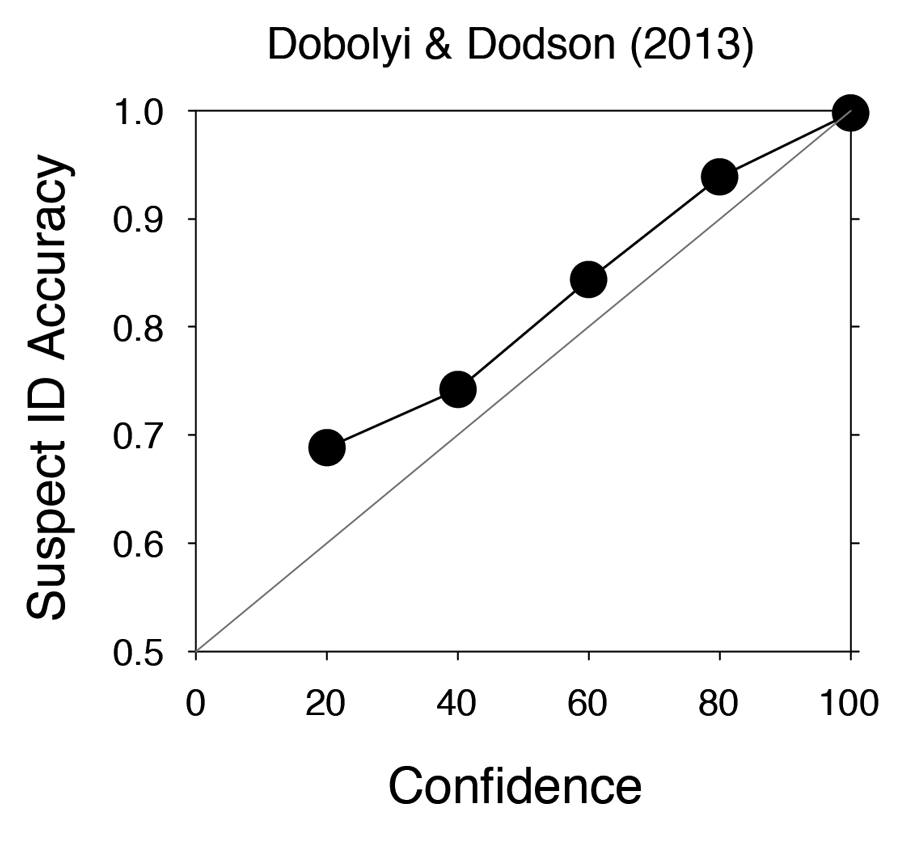
 When Humans and Other Animals Behave Irrationally
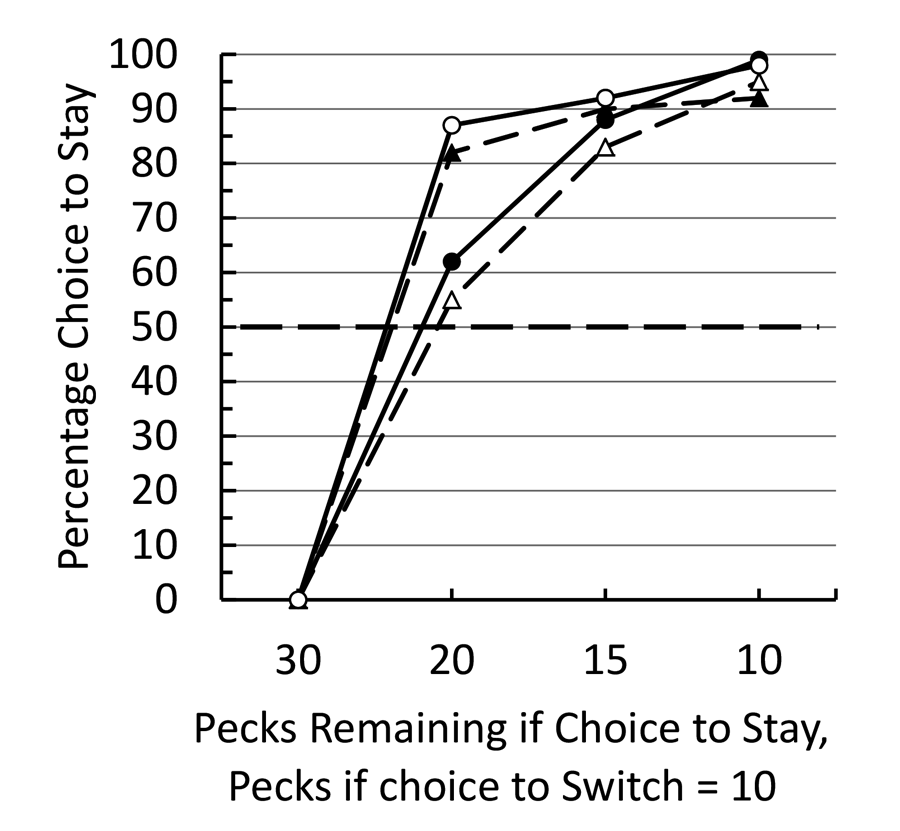
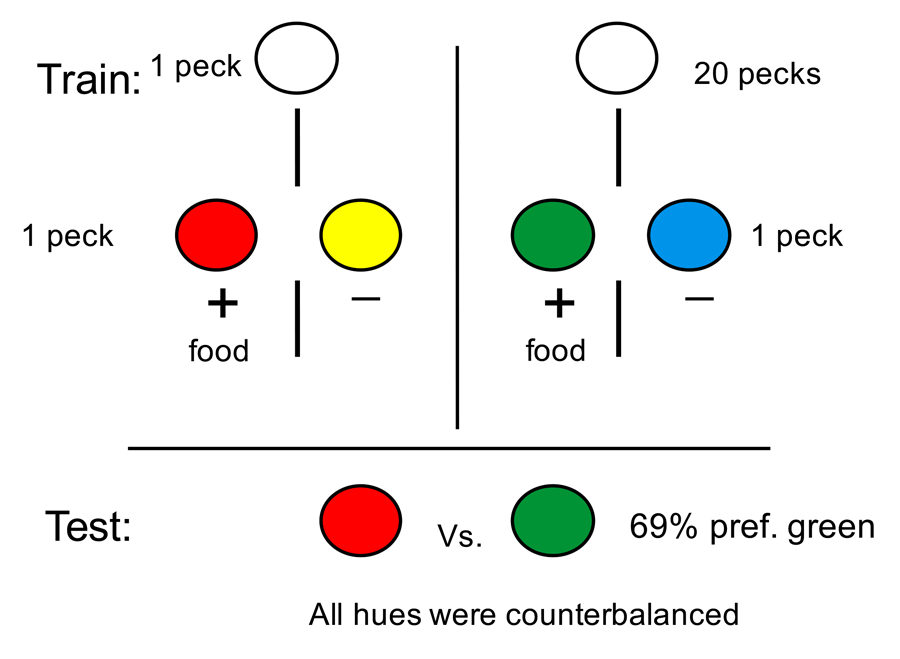
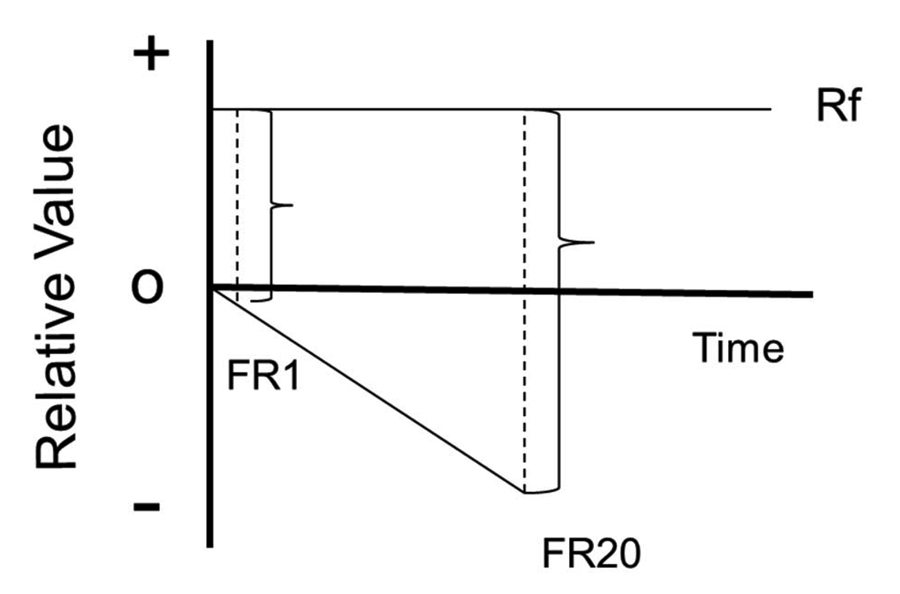

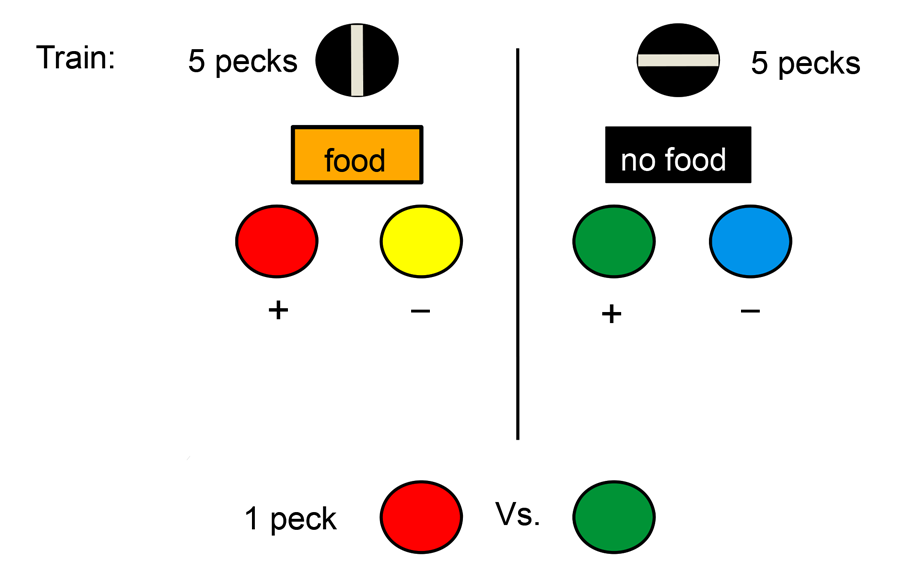
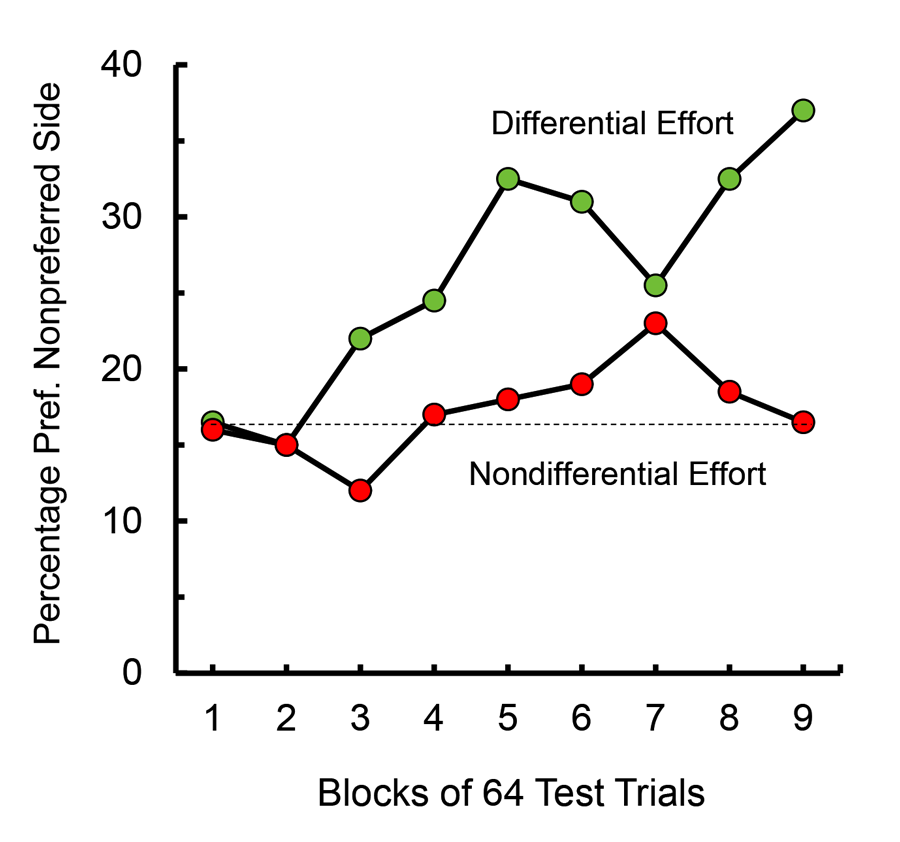
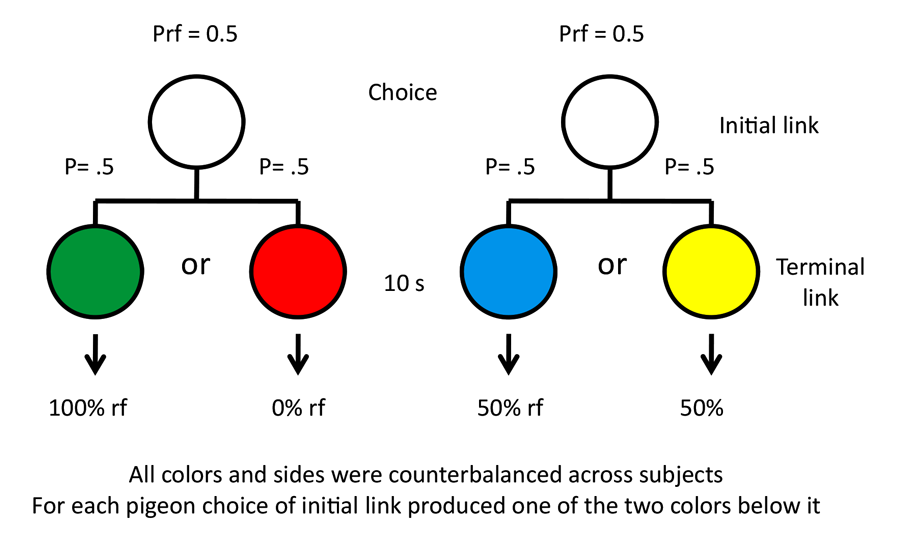
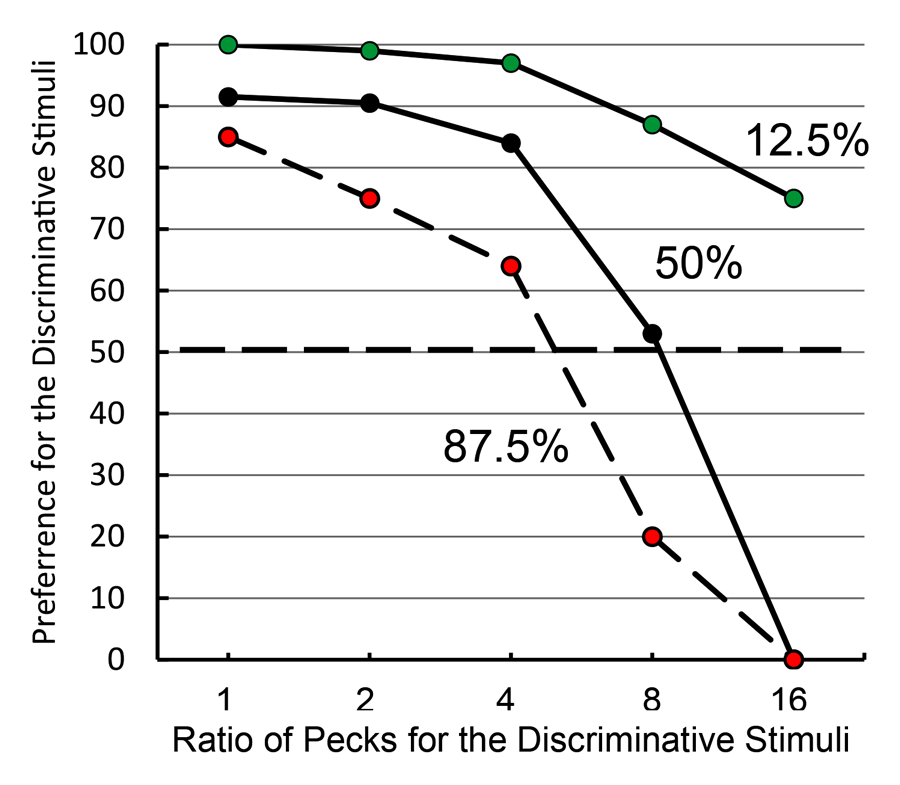
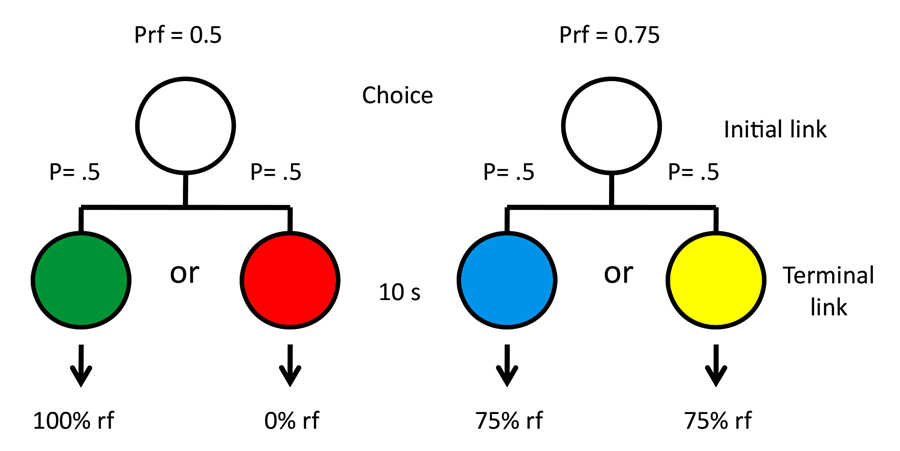
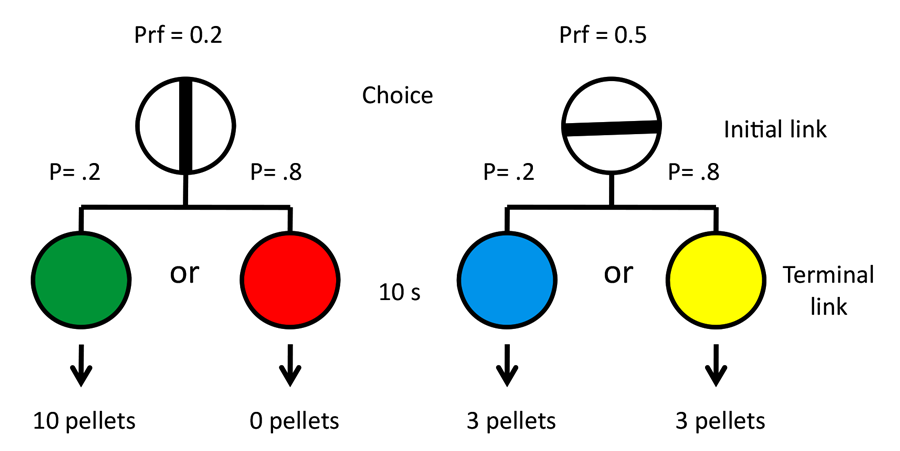
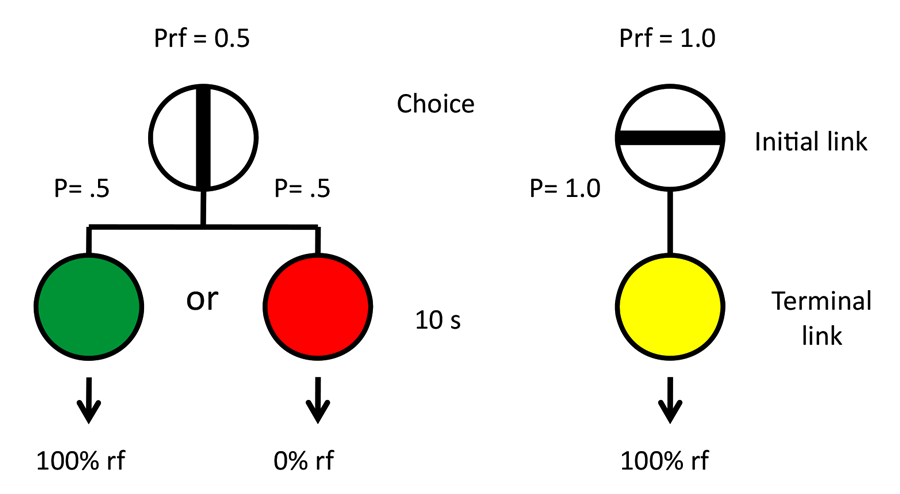
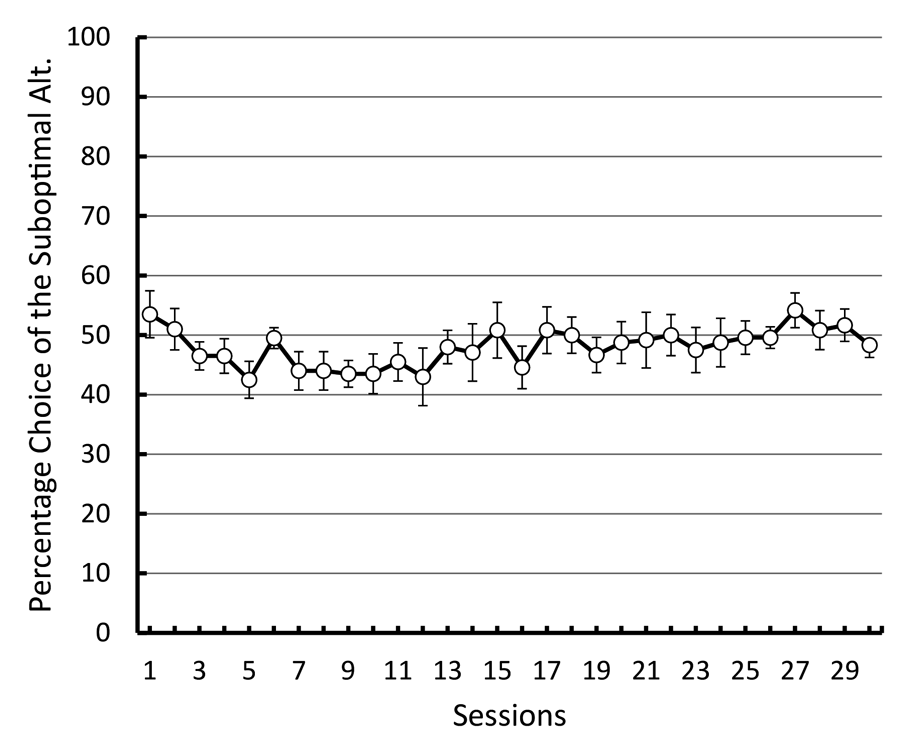
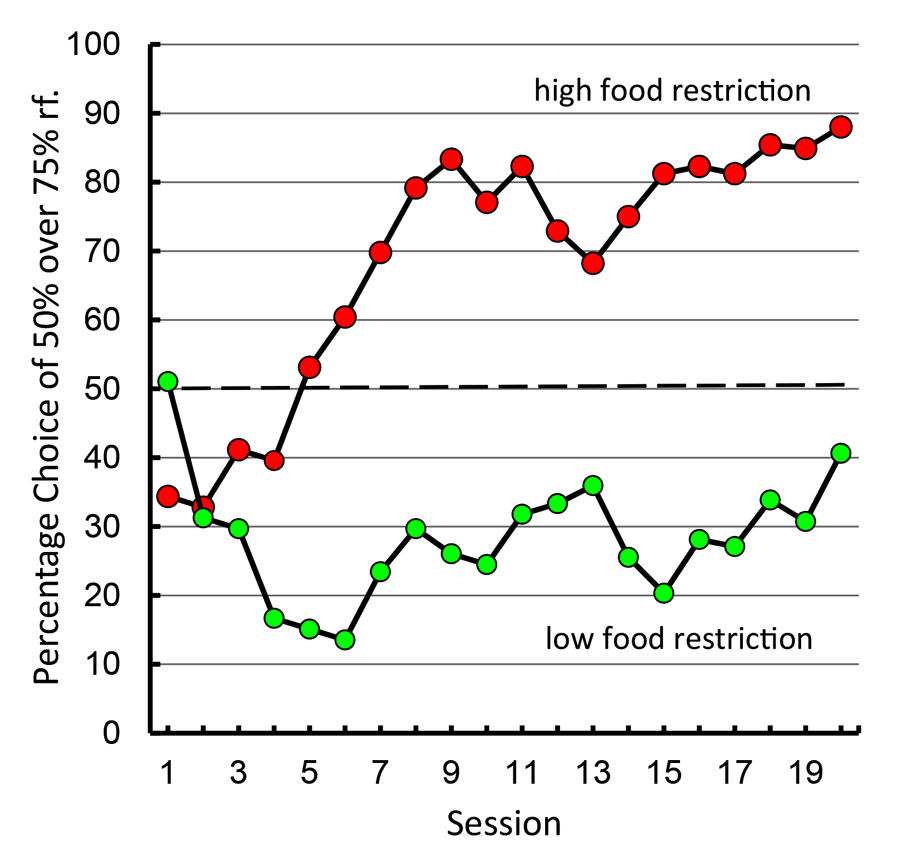
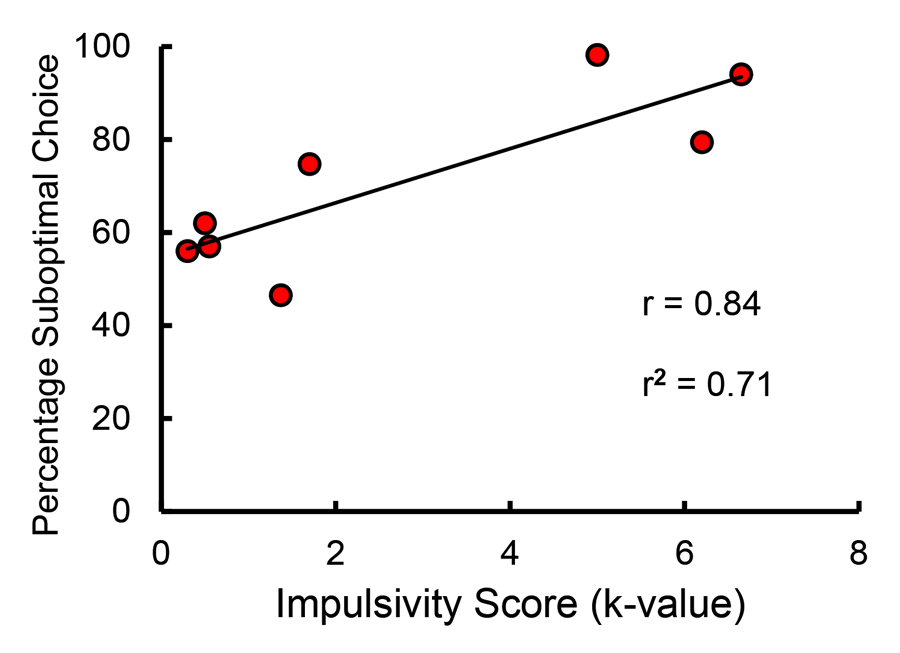
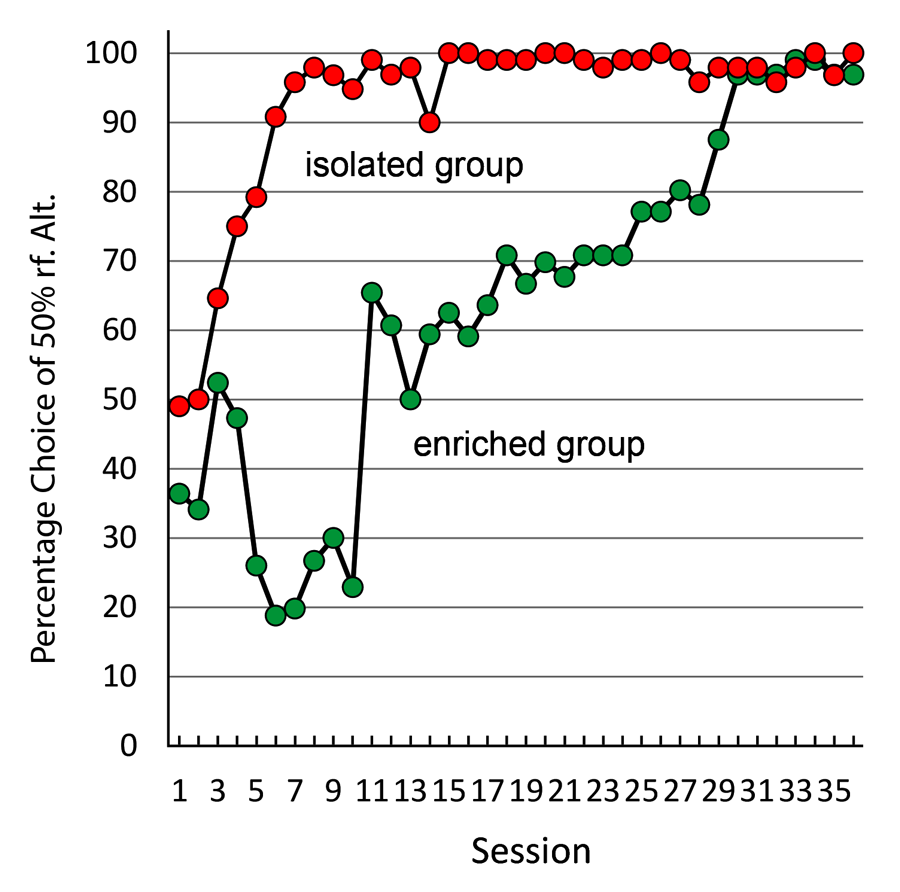

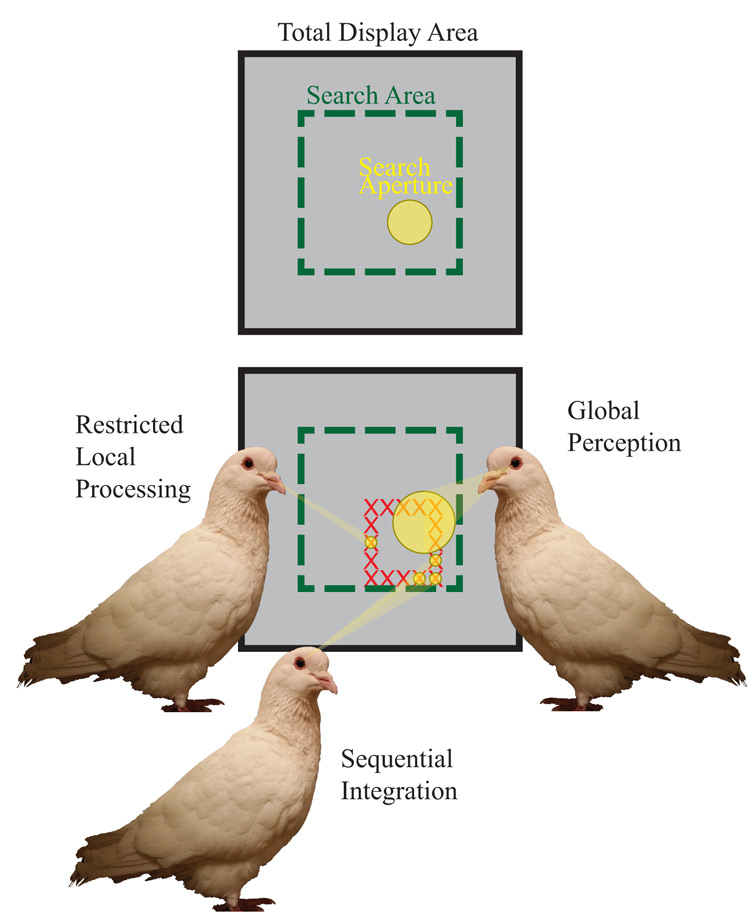
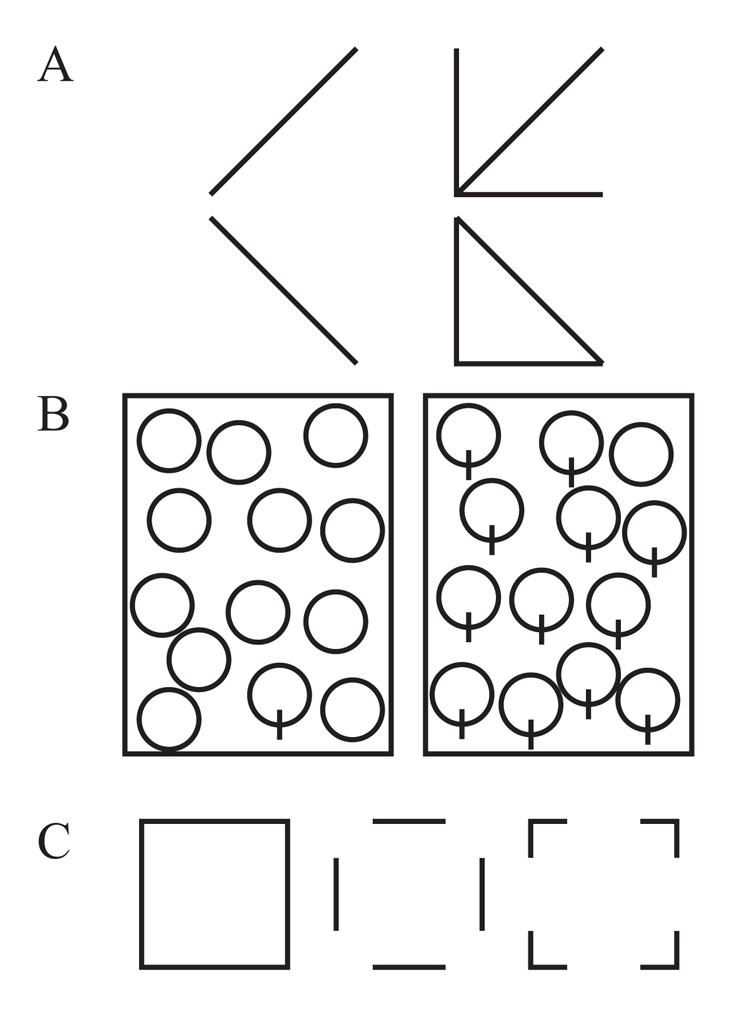

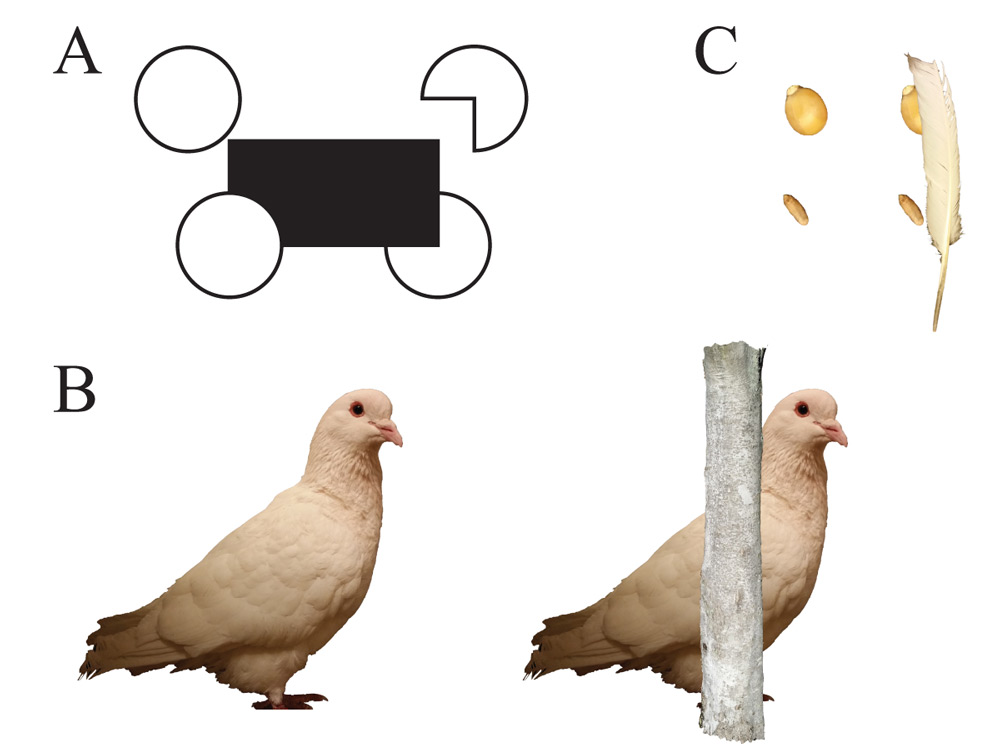
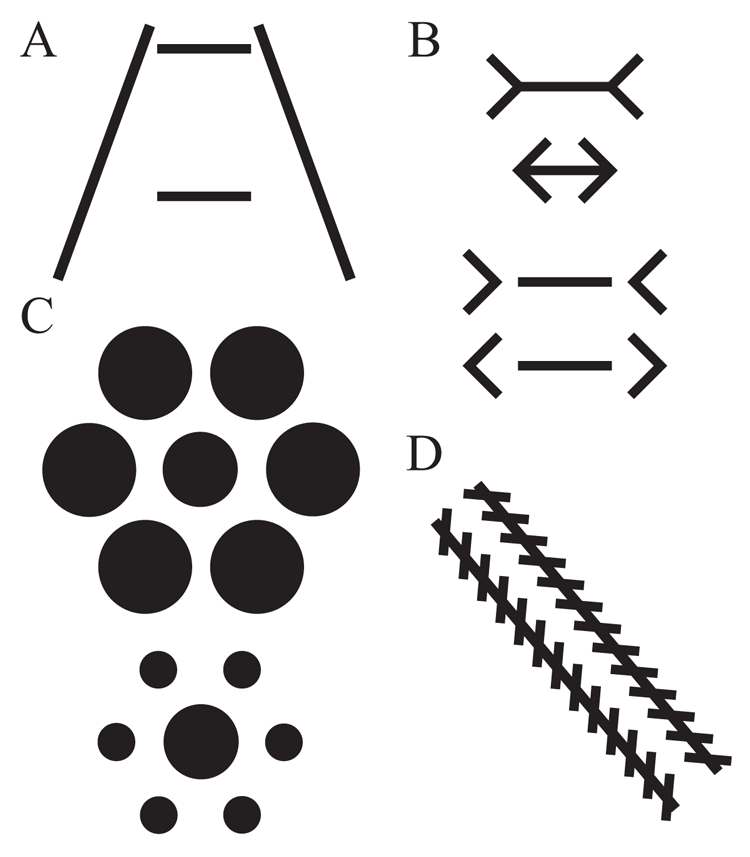
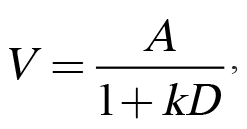
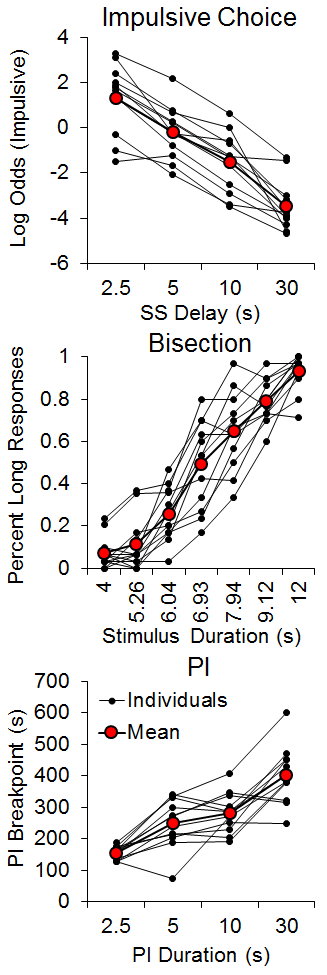
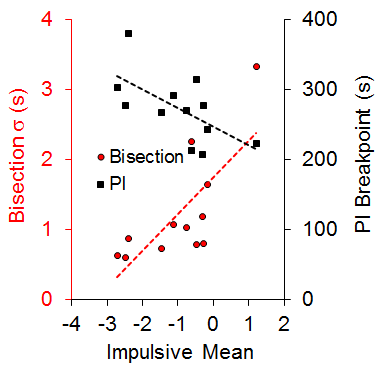
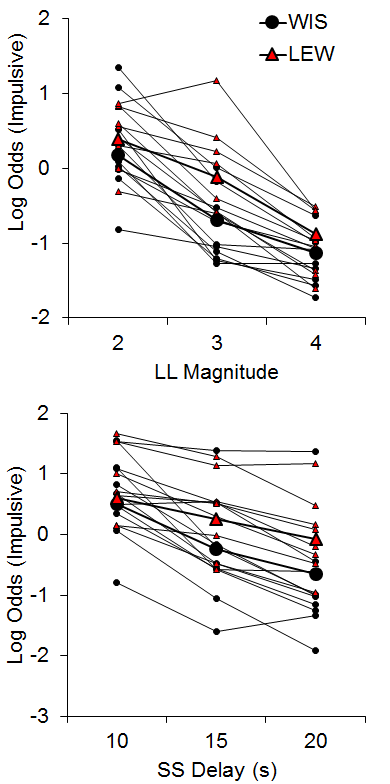
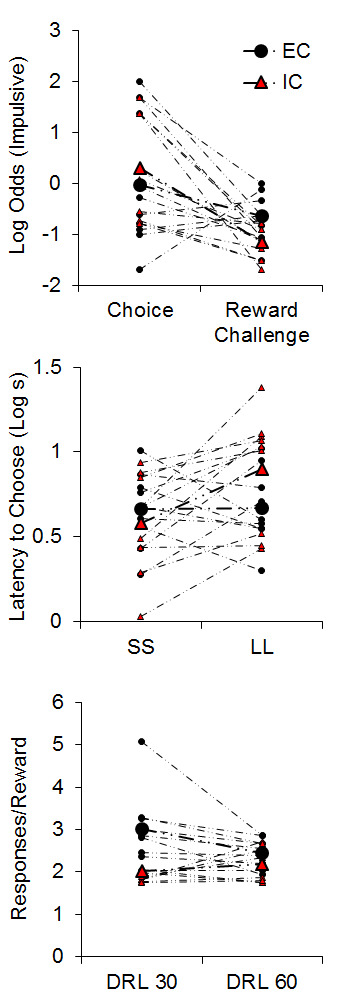
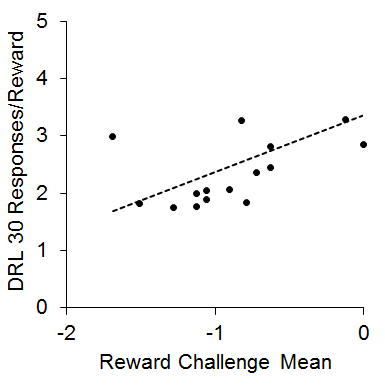
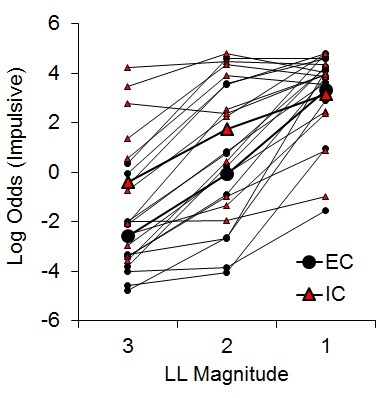
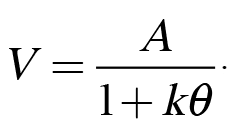
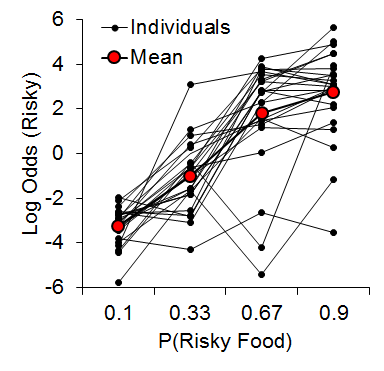
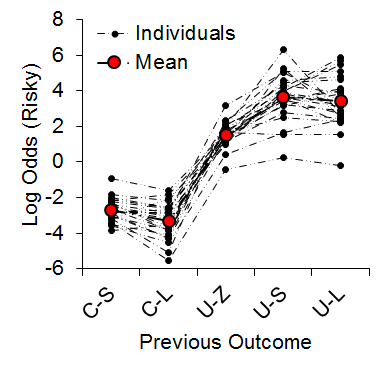
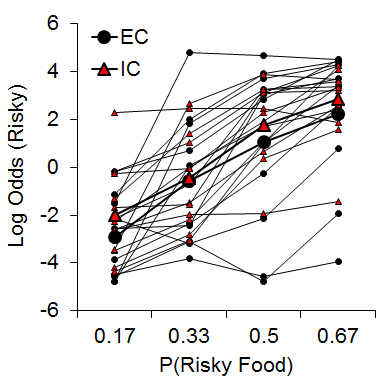
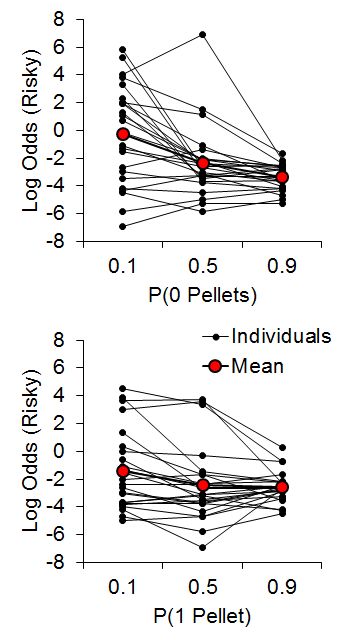
![Figure 11. Log odds of risky choices following uncertain-zero (U-Z) and uncertain-small (U-S) outcomes in the zero pellets [P(0 pellets); top] and one pellet [P(1 pellet); bottom] conditions. Adapted from Marshall and Kirkpatrick (2015).](https://comparative-cognition-and-behavior-reviews.org/wp/wp-content/uploads/2015/05/CCBR_Kirkpatrick_v10-2015_FIG11.png)